29
/
en
AIzaSyAYiBZKx7MnpbEhh9jyipgxe19OcubqV5w
April 1, 2024
152326
Hungary
HUN
true
2
1
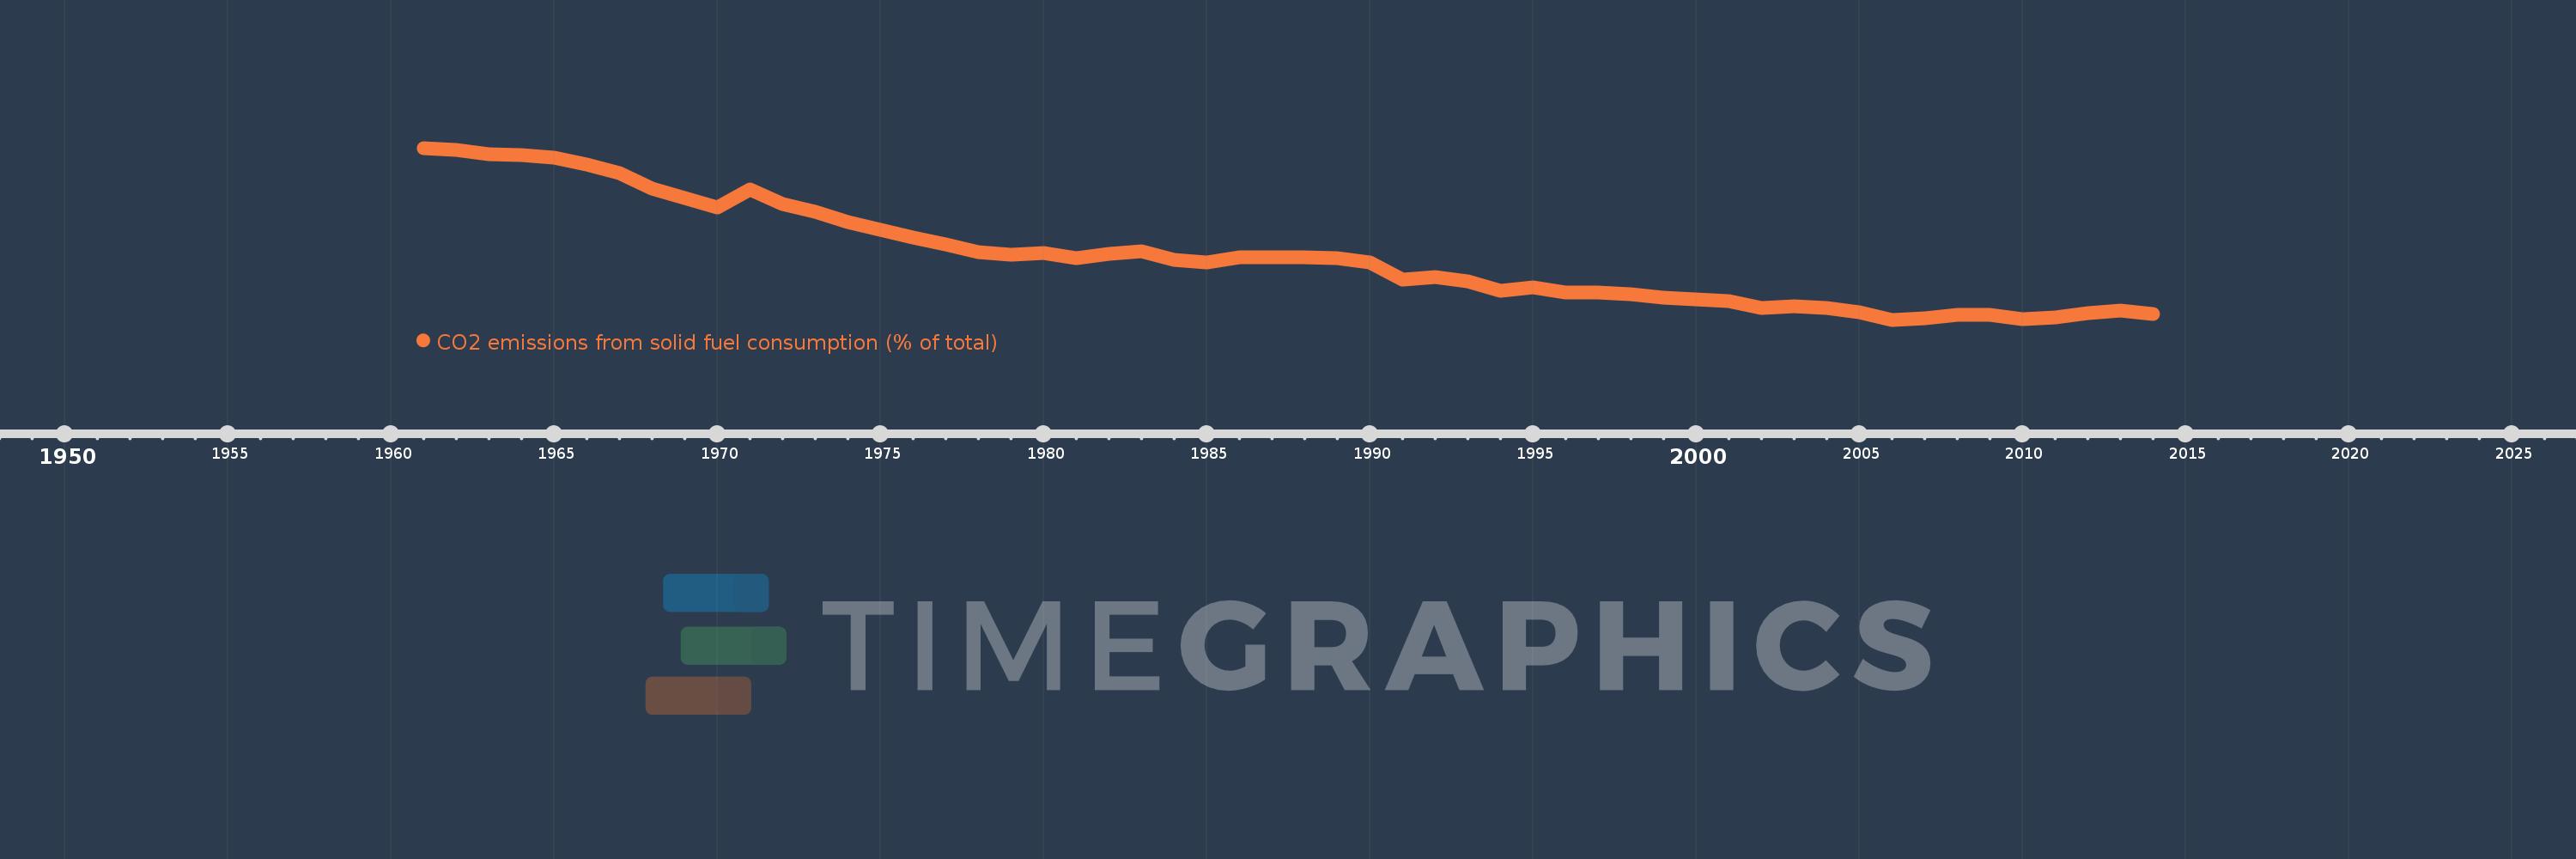
CO2 emissions from solid fuel consumption (% of total)
2014,2013,2012,2011,2010,2009,2008,2007,2006,2005,2004,2003,2002,2001,2000,1999,1998,1997,1996,1995,1994,1993,1992,1991,1990,1989,1988,1987,1986,1985,1984,1983,1982,1981,1980,1979,1978,1977,1976,1975,1974,1973,1972,1971,1970,1969,1968,1967,1966,1965,1964,1963,1962,1961
This statistics in other country:
AfghanistanAlbaniaAlgeriaAndorraAngolaAntigua and BarbudaArab WorldArgentinaArmeniaArubaAustraliaAustriaAzerbaijanBahamas, TheBahrainBangladeshBarbadosBelarusBelgiumBelizeBeninBermudaBhutanBoliviaBosnia and HerzegovinaBotswanaBrazilBritish Virgin IslandsBrunei DarussalamBulgariaBurkina FasoBurundiCabo VerdeCambodiaCameroonCanadaCaribbean small statesCayman IslandsCentral African RepublicCentral Europe and the BalticsChadChileChinaColombiaComorosCongo, Dem. Rep.Congo, Rep.Costa RicaCote d'IvoireCroatiaCubaCuracaoCyprusCzech RepublicDenmarkDjiboutiDominicaDominican RepublicEarly-demographic dividendEast Asia & PacificEast Asia & Pacific (excluding high income)East Asia & Pacific (IDA & IBRD countries)EcuadorEgypt, Arab Rep.El SalvadorEquatorial GuineaEritreaEstoniaEthiopiaEuro areaEurope & Central AsiaEurope & Central Asia (excluding high income)Europe & Central Asia (IDA & IBRD countries)European UnionFaroe IslandsFijiFinlandFragile and conflict affected situationsFranceFrench PolynesiaGabonGambia, TheGeorgiaGermanyGhanaGibraltarGreeceGreenlandGrenadaGuatemalaGuineaGuinea-BissauGuyanaHaitiHeavily indebted poor countries (HIPC)High incomeHondurasHong Kong SAR, ChinaHungaryIBRD onlyIcelandIDA & IBRD totalIDA blendIDA onlyIDA totalIndiaIndonesiaIran, Islamic Rep.IraqIrelandIsraelItalyJamaicaJapanJordanKazakhstanKenyaKiribatiKorea, Dem. People’s Rep.Korea, Rep.KuwaitKyrgyz RepublicLao PDRLate-demographic dividendLatin America & Caribbean Latin America & Caribbean (excluding high income)Latin America & the Caribbean (IDA & IBRD countries)LatviaLeast developed countries: UN classificationLebanonLesothoLiberiaLibyaLiechtensteinLithuaniaLow & middle incomeLow incomeLower middle incomeLuxembourgMacao SAR, ChinaMacedonia, FYRMadagascarMalawiMalaysiaMaldivesMaliMaltaMarshall IslandsMauritaniaMauritiusMexicoMicronesia, Fed. Sts.Middle East & North AfricaMiddle East & North Africa (excluding high income)Middle East & North Africa (IDA & IBRD countries)Middle incomeMoldovaMongoliaMontenegroMoroccoMozambiqueMyanmarNamibiaNauruNepalNetherlandsNew CaledoniaNew ZealandNicaraguaNigerNigeriaNorth AmericaNorwayOECD membersOmanOther small statesPacific island small statesPakistanPalauPanamaPapua New GuineaParaguayPeruPhilippinesPolandPortugalPost-demographic dividendPre-demographic dividendQatarRomaniaRussian FederationRwandaSamoaSao Tome and PrincipeSaudi ArabiaSenegalSerbiaSeychellesSierra LeoneSingaporeSint Maarten (Dutch part)Slovak RepublicSloveniaSmall statesSolomon IslandsSomaliaSouth AfricaSouth AsiaSouth Asia (IDA & IBRD)South SudanSpainSri LankaSt. Kitts and NevisSt. LuciaSt. Vincent and the GrenadinesSub-Saharan Africa Sub-Saharan Africa (excluding high income)Sub-Saharan Africa (IDA & IBRD countries)SudanSurinameSwazilandSwedenSwitzerlandSyrian Arab RepublicTajikistanTanzaniaThailandTimor-LesteTogoTongaTrinidad and TobagoTunisiaTurkeyTurkmenistanTurks and Caicos IslandsUgandaUkraineUnited Arab EmiratesUnited KingdomUnited StatesUpper middle incomeUruguayUzbekistanVanuatuVenezuela, RBVietnamWest Bank and GazaWorldYemen, Rep.ZambiaZimbabwe Timeline:
This timeline shows a graph from 1961 to 2014 of Hungary. No data until 1960. Number of actual observations by date: 54.
Source name:
World Development Indicators
Source organization:
Carbon Dioxide Information Analysis Center, Environmental Sciences Division, Oak Ridge National Laboratory, Tennessee, United States.
Categories, topics:
Climate Change, Environment
Last updated:
apr 23, 2017
Indicators value changes by year
At the date of observation
Value
Absolute change
Change from previous value
jan 1, 1961
80.49
+80.49
0.0%
jan 1, 1962
79.747
-0.743
-0.92%
jan 1, 1963
78.278
-1.469
-1.84%
jan 1, 1964
78.088
-0.19
-0.24%
jan 1, 1965
76.994
-1.095
-1.4%
jan 1, 1966
74.861
-2.133
-2.77%
jan 1, 1967
71.684
-3.177
-4.24%
jan 1, 1968
66.403
-5.281
-7.37%
jan 1, 1969
63.015
-3.388
-5.1%
jan 1, 1970
59.817
-3.198
-5.08%
jan 1, 1971
65.998
+6.181
10.33%
jan 1, 1972
60.986
-5.012
-7.59%
jan 1, 1973
58.276
-2.709
-4.44%
jan 1, 1974
54.778
-3.498
-6.0%
jan 1, 1975
52.073
-2.704
-4.94%
jan 1, 1976
49.287
-2.786
-5.35%
jan 1, 1977
46.893
-2.395
-4.86%
jan 1, 1978
44.231
-2.662
-5.68%
jan 1, 1979
43.179
-1.052
-2.38%
jan 1, 1980
43.789
+0.611
1.41%
jan 1, 1981
42.226
-1.563
-3.57%
jan 1, 1982
43.55
+1.325
3.14%
jan 1, 1983
44.491
+0.941
2.16%
jan 1, 1984
41.538
-2.954
-6.64%
jan 1, 1985
40.58
-0.958
-2.31%
jan 1, 1986
42.434
+1.855
4.57%
jan 1, 1987
42.505
+0.07
0.17%
jan 1, 1988
42.409
-0.096
-0.23%
jan 1, 1989
42.136
-0.273
-0.64%
jan 1, 1990
40.631
-1.504
-3.57%
jan 1, 1991
34.566
-6.065
-14.93%
jan 1, 1992
35.588
+1.022
2.96%
jan 1, 1993
34.011
-1.576
-4.43%
jan 1, 1994
30.907
-3.105
-9.13%
jan 1, 1995
31.806
+0.899
2.91%
jan 1, 1996
30.171
-1.635
-5.14%
jan 1, 1997
30.064
-0.107
-0.35%
jan 1, 1998
29.696
-0.368
-1.22%
jan 1, 1999
28.3
-1.395
-4.7%
jan 1, 2000
27.679
-0.622
-2.2%
jan 1, 2001
27.109
-0.57
-2.06%
jan 1, 2002
24.639
-2.47
-9.11%
jan 1, 2003
25.319
+0.679
2.76%
jan 1, 2004
24.877
-0.441
-1.74%
jan 1, 2005
23.243
-1.634
-6.57%
jan 1, 2006
20.68
-2.563
-11.03%
jan 1, 2007
21.24
+0.56
2.71%
jan 1, 2008
22.237
+0.997
4.69%
jan 1, 2009
22.239
+0.002
0.01%
jan 1, 2010
20.762
-1.476
-6.64%
jan 1, 2011
21.601
+0.838
4.04%
jan 1, 2012
23.109
+1.509
6.98%
jan 1, 2013
23.902
+0.793
3.43%
jan 1, 2014
22.564
-1.338
-5.6%
Ranking of countries by current statistics by years


Comments: