29
/
en
AIzaSyAYiBZKx7MnpbEhh9jyipgxe19OcubqV5w
April 1, 2024
282035
Vietnam
VNM
true
2
1
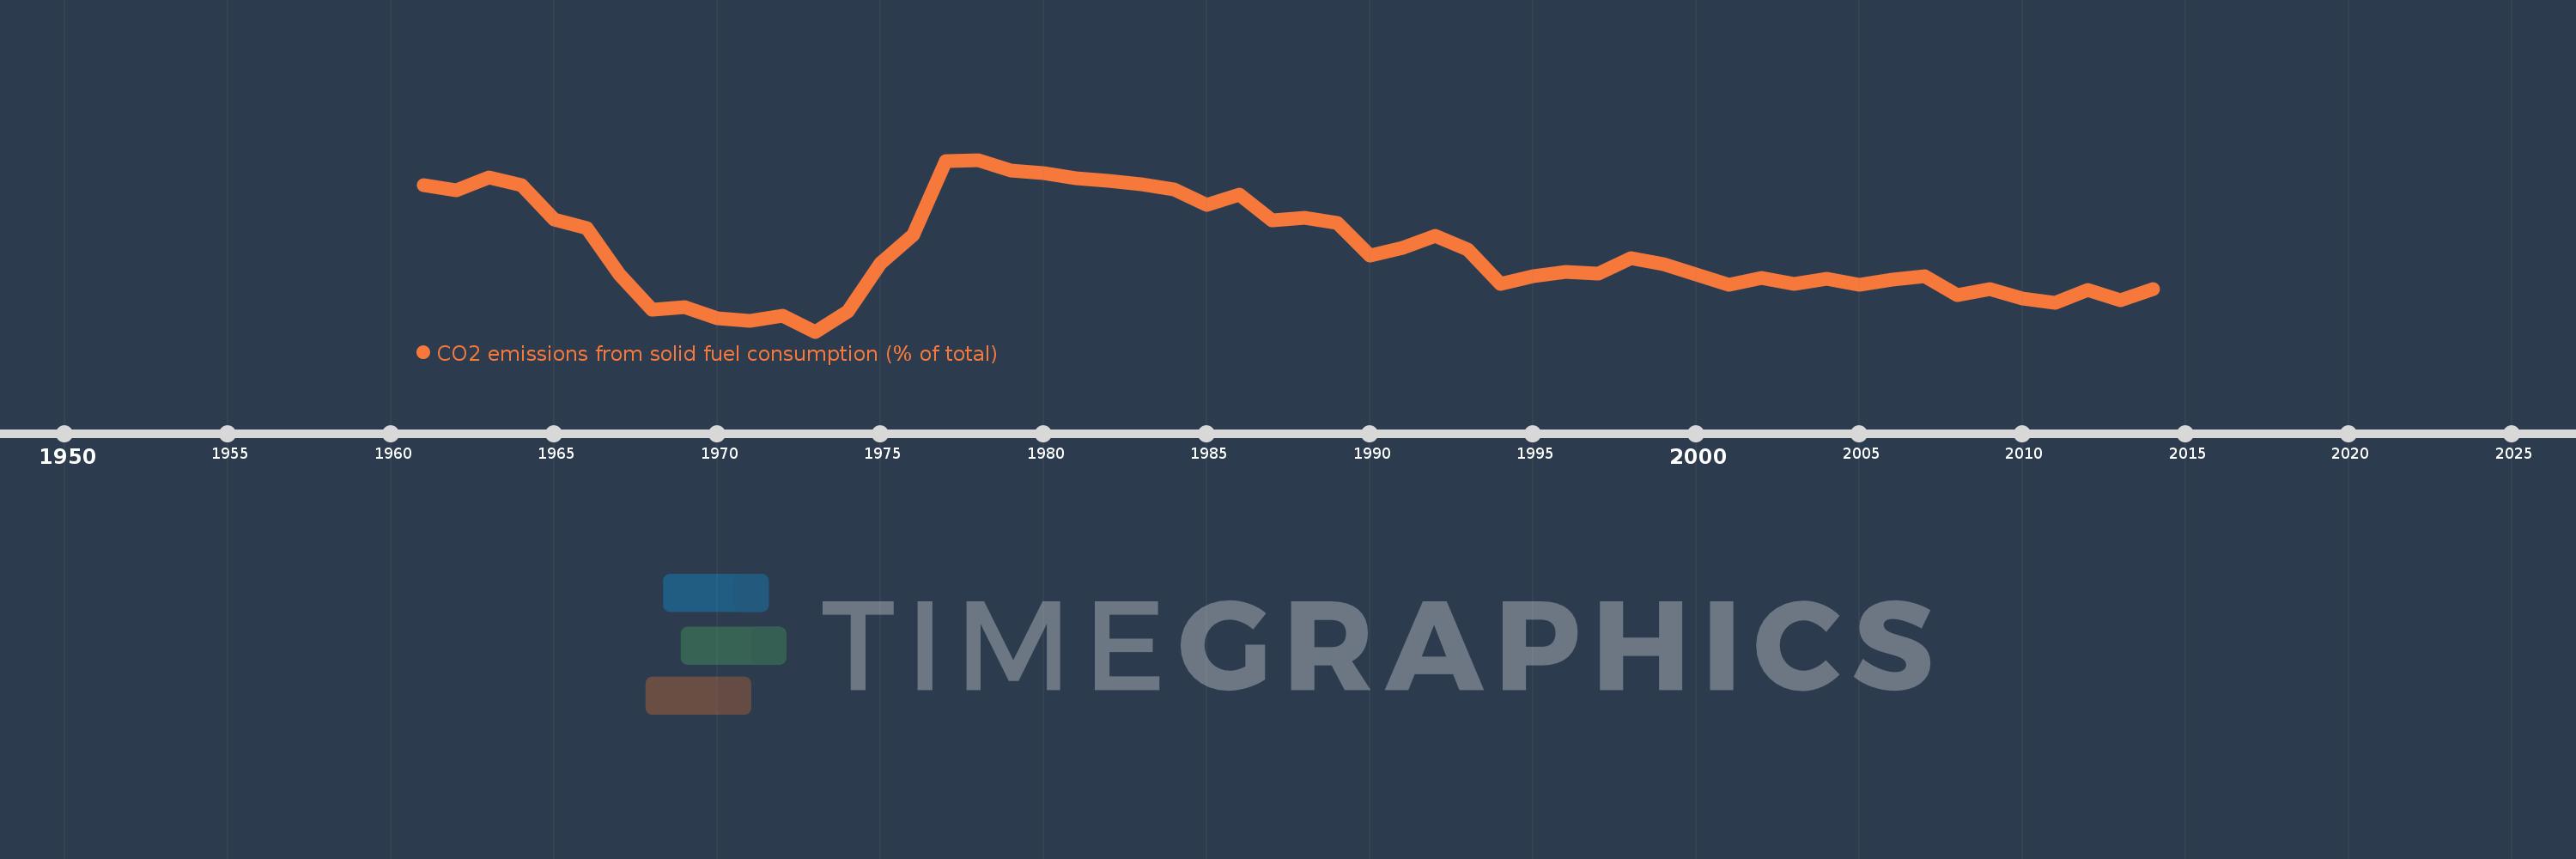
CO2 emissions from solid fuel consumption (% of total)
2014,2013,2012,2011,2010,2009,2008,2007,2006,2005,2004,2003,2002,2001,2000,1999,1998,1997,1996,1995,1994,1993,1992,1991,1990,1989,1988,1987,1986,1985,1984,1983,1982,1981,1980,1979,1978,1977,1976,1975,1974,1973,1972,1971,1970,1969,1968,1967,1966,1965,1964,1963,1962,1961
This statistics in other country:
AfghanistanAlbaniaAlgeriaAndorraAngolaAntigua and BarbudaArab WorldArgentinaArmeniaArubaAustraliaAustriaAzerbaijanBahamas, TheBahrainBangladeshBarbadosBelarusBelgiumBelizeBeninBermudaBhutanBoliviaBosnia and HerzegovinaBotswanaBrazilBritish Virgin IslandsBrunei DarussalamBulgariaBurkina FasoBurundiCabo VerdeCambodiaCameroonCanadaCaribbean small statesCayman IslandsCentral African RepublicCentral Europe and the BalticsChadChileChinaColombiaComorosCongo, Dem. Rep.Congo, Rep.Costa RicaCote d'IvoireCroatiaCubaCuracaoCyprusCzech RepublicDenmarkDjiboutiDominicaDominican RepublicEarly-demographic dividendEast Asia & PacificEast Asia & Pacific (excluding high income)East Asia & Pacific (IDA & IBRD countries)EcuadorEgypt, Arab Rep.El SalvadorEquatorial GuineaEritreaEstoniaEthiopiaEuro areaEurope & Central AsiaEurope & Central Asia (excluding high income)Europe & Central Asia (IDA & IBRD countries)European UnionFaroe IslandsFijiFinlandFragile and conflict affected situationsFranceFrench PolynesiaGabonGambia, TheGeorgiaGermanyGhanaGibraltarGreeceGreenlandGrenadaGuatemalaGuineaGuinea-BissauGuyanaHaitiHeavily indebted poor countries (HIPC)High incomeHondurasHong Kong SAR, ChinaHungaryIBRD onlyIcelandIDA & IBRD totalIDA blendIDA onlyIDA totalIndiaIndonesiaIran, Islamic Rep.IraqIrelandIsraelItalyJamaicaJapanJordanKazakhstanKenyaKiribatiKorea, Dem. People’s Rep.Korea, Rep.KuwaitKyrgyz RepublicLao PDRLate-demographic dividendLatin America & Caribbean Latin America & Caribbean (excluding high income)Latin America & the Caribbean (IDA & IBRD countries)LatviaLeast developed countries: UN classificationLebanonLesothoLiberiaLibyaLiechtensteinLithuaniaLow & middle incomeLow incomeLower middle incomeLuxembourgMacao SAR, ChinaMacedonia, FYRMadagascarMalawiMalaysiaMaldivesMaliMaltaMarshall IslandsMauritaniaMauritiusMexicoMicronesia, Fed. Sts.Middle East & North AfricaMiddle East & North Africa (excluding high income)Middle East & North Africa (IDA & IBRD countries)Middle incomeMoldovaMongoliaMontenegroMoroccoMozambiqueMyanmarNamibiaNauruNepalNetherlandsNew CaledoniaNew ZealandNicaraguaNigerNigeriaNorth AmericaNorwayOECD membersOmanOther small statesPacific island small statesPakistanPalauPanamaPapua New GuineaParaguayPeruPhilippinesPolandPortugalPost-demographic dividendPre-demographic dividendQatarRomaniaRussian FederationRwandaSamoaSao Tome and PrincipeSaudi ArabiaSenegalSerbiaSeychellesSierra LeoneSingaporeSint Maarten (Dutch part)Slovak RepublicSloveniaSmall statesSolomon IslandsSomaliaSouth AfricaSouth AsiaSouth Asia (IDA & IBRD)South SudanSpainSri LankaSt. Kitts and NevisSt. LuciaSt. Vincent and the GrenadinesSub-Saharan Africa Sub-Saharan Africa (excluding high income)Sub-Saharan Africa (IDA & IBRD countries)SudanSurinameSwazilandSwedenSwitzerlandSyrian Arab RepublicTajikistanTanzaniaThailandTimor-LesteTogoTongaTrinidad and TobagoTunisiaTurkeyTurkmenistanTurks and Caicos IslandsUgandaUkraineUnited Arab EmiratesUnited KingdomUnited StatesUpper middle incomeUruguayUzbekistanVanuatuVenezuela, RBVietnamWest Bank and GazaWorldYemen, Rep.ZambiaZimbabwe Timeline:
This timeline shows a graph from 1961 to 2014 of Vietnam. No data until 1960. Number of actual observations by date: 54.
Source name:
World Development Indicators
Source organization:
Carbon Dioxide Information Analysis Center, Environmental Sciences Division, Oak Ridge National Laboratory, Tennessee, United States.
Categories, topics:
Climate Change, Environment
Last updated:
apr 23, 2017
Indicators value changes by year
Minimum:
22.137
jan 1, 1973
Maximum:
82.333
jan 1, 1978
At the date of observation
Value
Absolute change
Change from previous value
jan 1, 1961
73.324
+73.324
0.0%
jan 1, 1962
71.763
-1.56
-2.13%
jan 1, 1963
76.265
+4.502
6.27%
jan 1, 1964
73.422
-2.843
-3.73%
jan 1, 1965
61.56
-11.862
-16.16%
jan 1, 1966
58.44
-3.12
-5.07%
jan 1, 1967
42.074
-16.366
-28.0%
jan 1, 1968
29.706
-12.368
-29.39%
jan 1, 1969
30.596
+0.89
2.99%
jan 1, 1970
26.73
-3.866
-12.64%
jan 1, 1971
25.865
-0.865
-3.24%
jan 1, 1972
27.598
+1.733
6.7%
jan 1, 1973
22.137
-5.46
-19.78%
jan 1, 1974
29.31
+7.173
32.4%
jan 1, 1975
46.061
+16.75
57.15%
jan 1, 1976
55.913
+9.852
21.39%
jan 1, 1977
81.88
+25.968
46.44%
jan 1, 1978
82.333
+0.453
0.55%
jan 1, 1979
78.692
-3.641
-4.42%
jan 1, 1980
77.545
-1.147
-1.46%
jan 1, 1981
75.779
-1.766
-2.28%
jan 1, 1982
74.907
-0.872
-1.15%
jan 1, 1983
73.668
-1.238
-1.65%
jan 1, 1984
71.963
-1.706
-2.32%
jan 1, 1985
66.569
-5.394
-7.5%
jan 1, 1986
70.166
+3.597
5.4%
jan 1, 1987
61.077
-9.09
-12.95%
jan 1, 1988
61.903
+0.827
1.35%
jan 1, 1989
60.218
-1.685
-2.72%
jan 1, 1990
48.796
-11.422
-18.97%
jan 1, 1991
51.524
+2.729
5.59%
jan 1, 1992
55.812
+4.287
8.32%
jan 1, 1993
51.016
-4.796
-8.59%
jan 1, 1994
38.699
-12.316
-24.14%
jan 1, 1995
41.633
+2.933
7.58%
jan 1, 1996
43.174
+1.541
3.7%
jan 1, 1997
42.575
-0.6
-1.39%
jan 1, 1998
47.768
+5.194
12.2%
jan 1, 1999
45.674
-2.094
-4.38%
jan 1, 2000
42.034
-3.64
-7.97%
jan 1, 2001
38.649
-3.385
-8.05%
jan 1, 2002
40.844
+2.195
5.68%
jan 1, 2003
38.858
-1.987
-4.86%
jan 1, 2004
40.628
+1.771
4.56%
jan 1, 2005
38.456
-2.172
-5.35%
jan 1, 2006
40.237
+1.781
4.63%
jan 1, 2007
41.636
+1.399
3.48%
jan 1, 2008
34.798
-6.838
-16.42%
jan 1, 2009
37.017
+2.219
6.38%
jan 1, 2010
33.744
-3.273
-8.84%
jan 1, 2011
32.24
-1.504
-4.46%
jan 1, 2012
36.816
+4.576
14.19%
jan 1, 2013
33.059
-3.757
-10.2%
jan 1, 2014
36.902
+3.843
11.62%
Ranking of countries by current statistics by years


Comments: