29
/
en
AIzaSyAYiBZKx7MnpbEhh9jyipgxe19OcubqV5w
April 1, 2024
24737
Caribbean small states
CSS
false
2
1
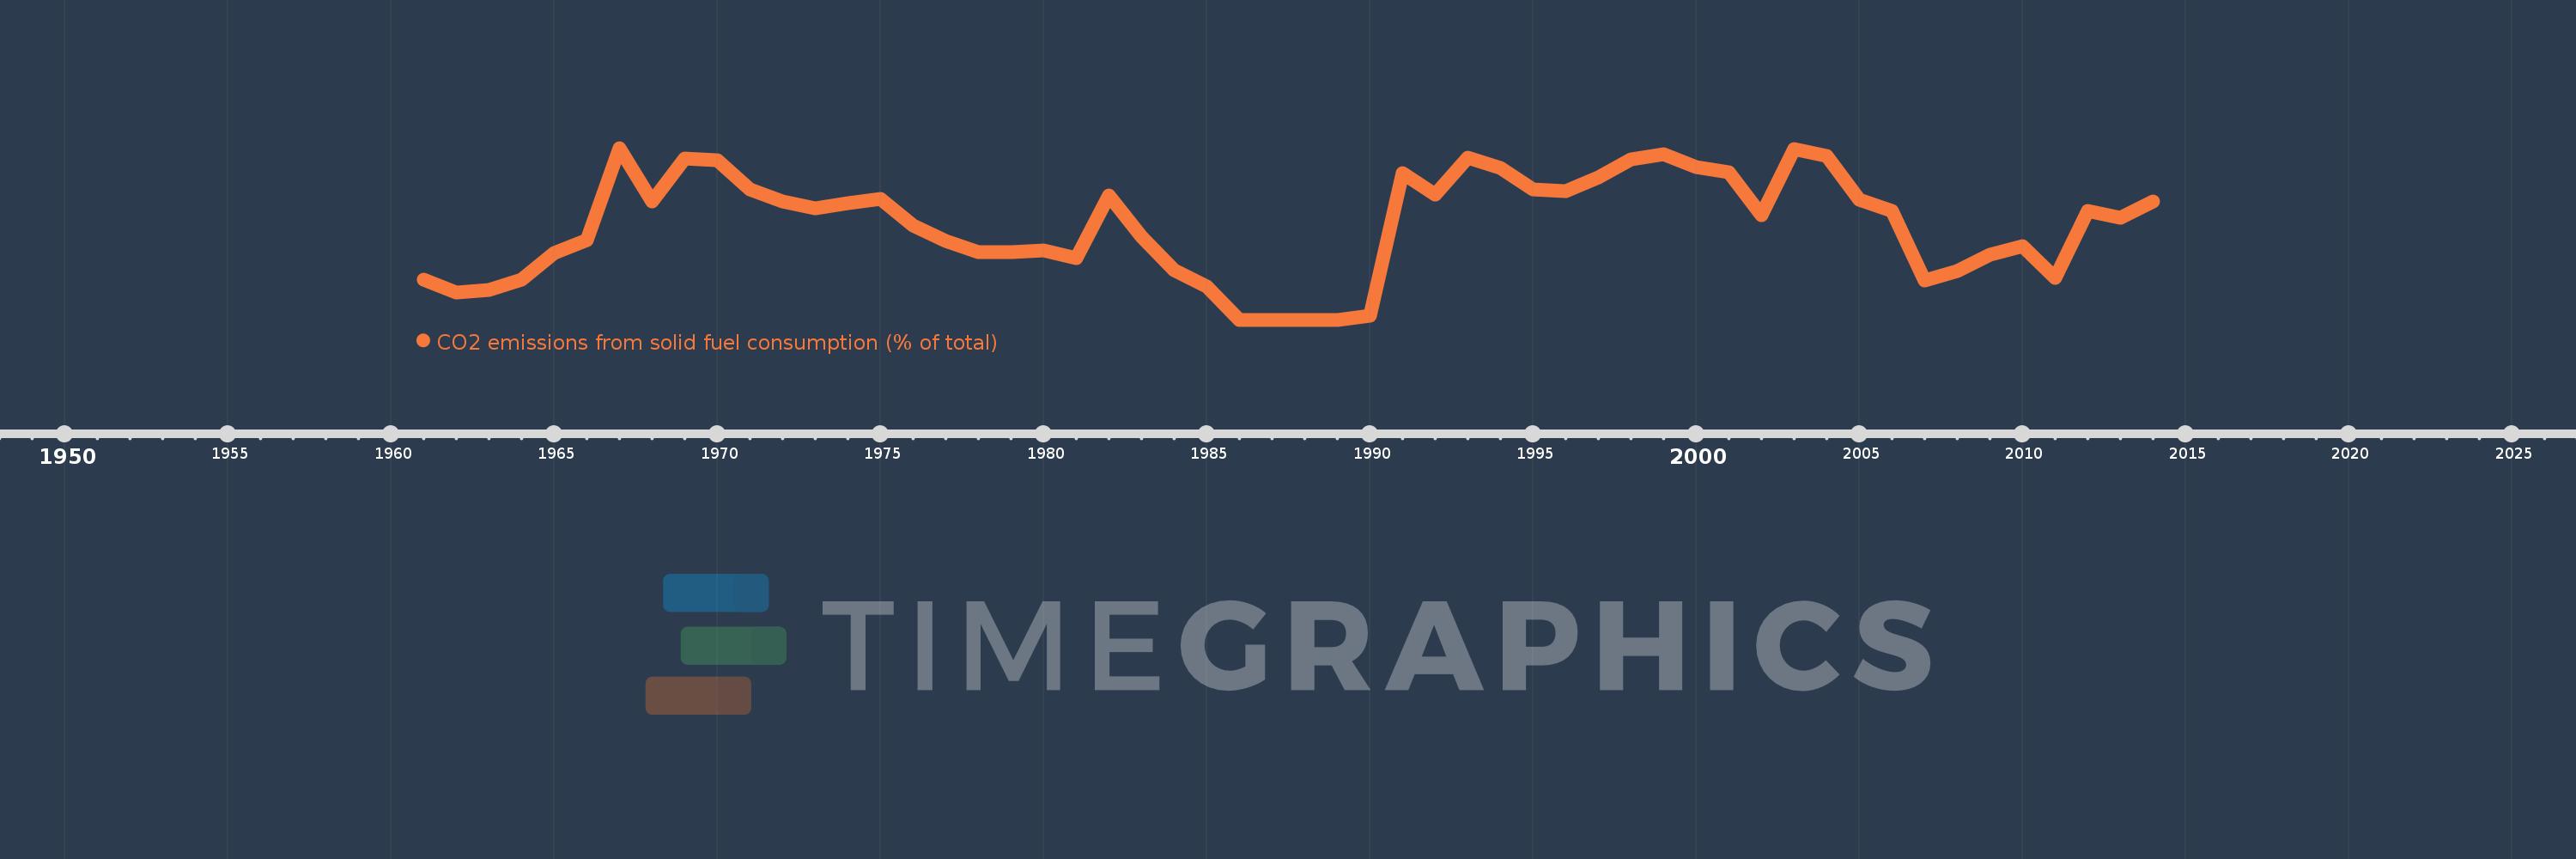
CO2 emissions from solid fuel consumption (% of total)
2014,2013,2012,2011,2010,2009,2008,2007,2006,2005,2004,2003,2002,2001,2000,1999,1998,1997,1996,1995,1994,1993,1992,1991,1990,1989,1988,1987,1986,1985,1984,1983,1982,1981,1980,1979,1978,1977,1976,1975,1974,1973,1972,1971,1970,1969,1968,1967,1966,1965,1964,1963,1962,1961
This statistics in other country:
AfghanistanAlbaniaAlgeriaAndorraAngolaAntigua and BarbudaArab WorldArgentinaArmeniaArubaAustraliaAustriaAzerbaijanBahamas, TheBahrainBangladeshBarbadosBelarusBelgiumBelizeBeninBermudaBhutanBoliviaBosnia and HerzegovinaBotswanaBrazilBritish Virgin IslandsBrunei DarussalamBulgariaBurkina FasoBurundiCabo VerdeCambodiaCameroonCanadaCaribbean small statesCayman IslandsCentral African RepublicCentral Europe and the BalticsChadChileChinaColombiaComorosCongo, Dem. Rep.Congo, Rep.Costa RicaCote d'IvoireCroatiaCubaCuracaoCyprusCzech RepublicDenmarkDjiboutiDominicaDominican RepublicEarly-demographic dividendEast Asia & PacificEast Asia & Pacific (excluding high income)East Asia & Pacific (IDA & IBRD countries)EcuadorEgypt, Arab Rep.El SalvadorEquatorial GuineaEritreaEstoniaEthiopiaEuro areaEurope & Central AsiaEurope & Central Asia (excluding high income)Europe & Central Asia (IDA & IBRD countries)European UnionFaroe IslandsFijiFinlandFragile and conflict affected situationsFranceFrench PolynesiaGabonGambia, TheGeorgiaGermanyGhanaGibraltarGreeceGreenlandGrenadaGuatemalaGuineaGuinea-BissauGuyanaHaitiHeavily indebted poor countries (HIPC)High incomeHondurasHong Kong SAR, ChinaHungaryIBRD onlyIcelandIDA & IBRD totalIDA blendIDA onlyIDA totalIndiaIndonesiaIran, Islamic Rep.IraqIrelandIsraelItalyJamaicaJapanJordanKazakhstanKenyaKiribatiKorea, Dem. People’s Rep.Korea, Rep.KuwaitKyrgyz RepublicLao PDRLate-demographic dividendLatin America & Caribbean Latin America & Caribbean (excluding high income)Latin America & the Caribbean (IDA & IBRD countries)LatviaLeast developed countries: UN classificationLebanonLesothoLiberiaLibyaLiechtensteinLithuaniaLow & middle incomeLow incomeLower middle incomeLuxembourgMacao SAR, ChinaMacedonia, FYRMadagascarMalawiMalaysiaMaldivesMaliMaltaMarshall IslandsMauritaniaMauritiusMexicoMicronesia, Fed. Sts.Middle East & North AfricaMiddle East & North Africa (excluding high income)Middle East & North Africa (IDA & IBRD countries)Middle incomeMoldovaMongoliaMontenegroMoroccoMozambiqueMyanmarNamibiaNauruNepalNetherlandsNew CaledoniaNew ZealandNicaraguaNigerNigeriaNorth AmericaNorwayOECD membersOmanOther small statesPacific island small statesPakistanPalauPanamaPapua New GuineaParaguayPeruPhilippinesPolandPortugalPost-demographic dividendPre-demographic dividendQatarRomaniaRussian FederationRwandaSamoaSao Tome and PrincipeSaudi ArabiaSenegalSerbiaSeychellesSierra LeoneSingaporeSint Maarten (Dutch part)Slovak RepublicSloveniaSmall statesSolomon IslandsSomaliaSouth AfricaSouth AsiaSouth Asia (IDA & IBRD)South SudanSpainSri LankaSt. Kitts and NevisSt. LuciaSt. Vincent and the GrenadinesSub-Saharan Africa Sub-Saharan Africa (excluding high income)Sub-Saharan Africa (IDA & IBRD countries)SudanSurinameSwazilandSwedenSwitzerlandSyrian Arab RepublicTajikistanTanzaniaThailandTimor-LesteTogoTongaTrinidad and TobagoTunisiaTurkeyTurkmenistanTurks and Caicos IslandsUgandaUkraineUnited Arab EmiratesUnited KingdomUnited StatesUpper middle incomeUruguayUzbekistanVanuatuVenezuela, RBVietnamWest Bank and GazaWorldYemen, Rep.ZambiaZimbabwe Timeline:
This timeline shows a graph from 1961 to 2014 of Caribbean small states. No data until 1960. Number of actual observations by date: 54.
Source name:
World Development Indicators
Source organization:
Carbon Dioxide Information Analysis Center, Environmental Sciences Division, Oak Ridge National Laboratory, Tennessee, United States.
Categories, topics:
Climate Change, Environment
Last updated:
apr 23, 2017
Indicators value changes by year
At the date of observation
Value
Absolute change
Change from previous value
jan 1, 1961
0.125
+0.125
0.0%
jan 1, 1962
0.083
-0.041
-33.24%
jan 1, 1963
0.093
+0.01
12.2%
jan 1, 1964
0.123
+0.029
31.13%
jan 1, 1965
0.207
+0.084
68.54%
jan 1, 1966
0.246
+0.04
19.18%
jan 1, 1967
0.53
+0.284
115.42%
jan 1, 1968
0.366
-0.164
-30.97%
jan 1, 1969
0.497
+0.131
35.71%
jan 1, 1970
0.493
-0.004
-0.71%
jan 1, 1971
0.402
-0.091
-18.42%
jan 1, 1972
0.366
-0.037
-9.09%
jan 1, 1973
0.344
-0.022
-5.95%
jan 1, 1974
0.359
+0.015
4.26%
jan 1, 1975
0.373
+0.014
4.03%
jan 1, 1976
0.29
-0.083
-22.21%
jan 1, 1977
0.243
-0.048
-16.42%
jan 1, 1978
0.209
-0.034
-13.86%
jan 1, 1979
0.208
-0.001
-0.65%
jan 1, 1980
0.215
+0.007
3.55%
jan 1, 1981
0.189
-0.026
-12.16%
jan 1, 1982
0.383
+0.194
102.73%
jan 1, 1983
0.255
-0.128
-33.36%
jan 1, 1984
0.154
-0.101
-39.78%
jan 1, 1985
0.102
-0.052
-33.93%
jan 1, 1986
0.0
-0.102
-100.0%
jan 1, 1990
0.012
+0.012
%
jan 1, 1991
0.452
+0.44
3.59K%
jan 1, 1992
0.385
-0.068
-14.96%
jan 1, 1993
0.501
+0.116
30.15%
jan 1, 1994
0.467
-0.034
-6.71%
jan 1, 1995
0.403
-0.064
-13.7%
jan 1, 1996
0.397
-0.006
-1.44%
jan 1, 1997
0.44
+0.042
10.61%
jan 1, 1998
0.495
+0.056
12.66%
jan 1, 1999
0.511
+0.015
3.09%
jan 1, 2000
0.471
-0.039
-7.65%
jan 1, 2001
0.455
-0.016
-3.41%
jan 1, 2002
0.322
-0.133
-29.27%
jan 1, 2003
0.526
+0.204
63.4%
jan 1, 2004
0.505
-0.022
-4.09%
jan 1, 2005
0.369
-0.136
-26.95%
jan 1, 2006
0.335
-0.034
-9.24%
jan 1, 2007
0.122
-0.213
-63.53%
jan 1, 2008
0.149
+0.027
21.92%
jan 1, 2009
0.201
+0.052
35.19%
jan 1, 2010
0.226
+0.024
12.12%
jan 1, 2011
0.128
-0.097
-43.17%
jan 1, 2012
0.336
+0.208
162.19%
jan 1, 2013
0.315
-0.021
-6.38%
jan 1, 2014
0.365
+0.051
16.13%
Ranking of countries by current statistics by years


Comments: