29
/
en
AIzaSyAYiBZKx7MnpbEhh9jyipgxe19OcubqV5w
April 1, 2024
214119
Norway
NOR
true
2
1
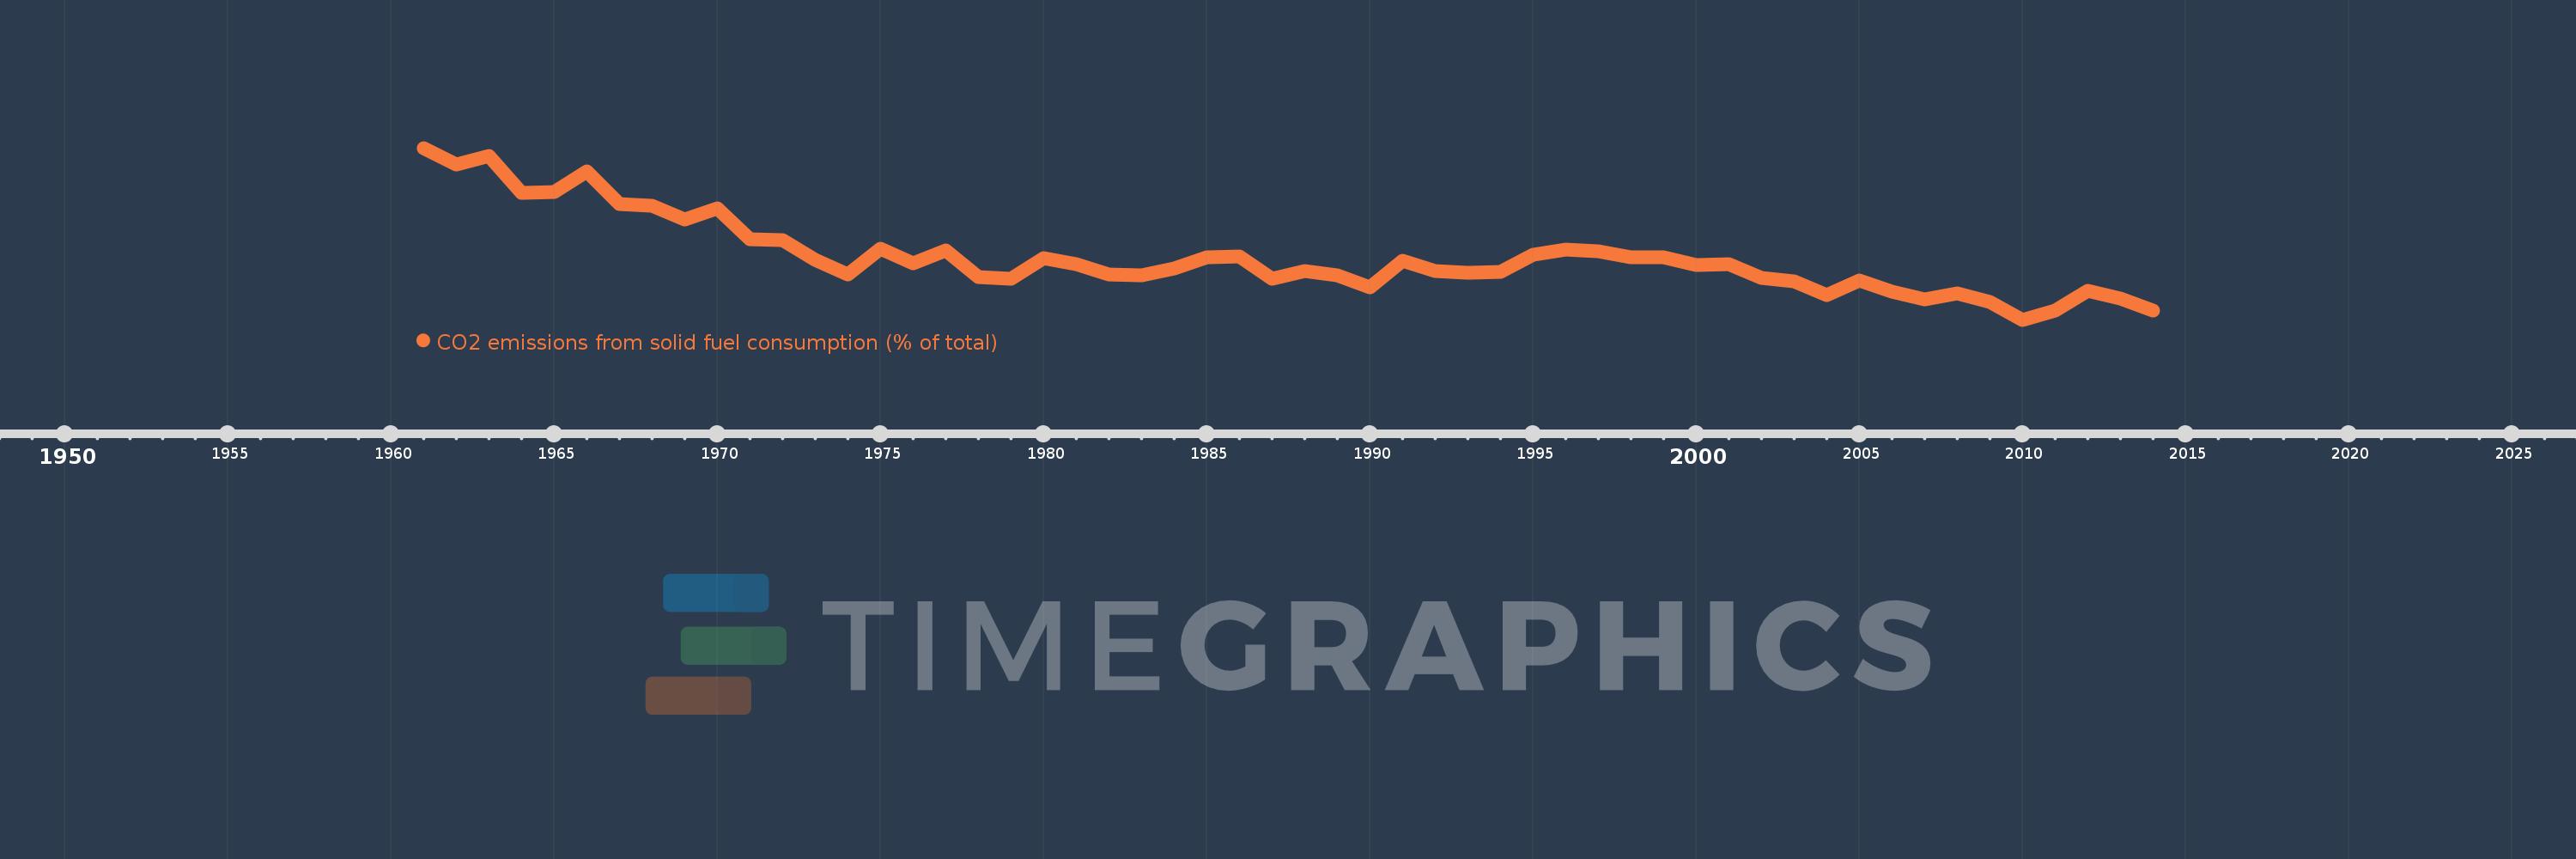
CO2 emissions from solid fuel consumption (% of total)
2014,2013,2012,2011,2010,2009,2008,2007,2006,2005,2004,2003,2002,2001,2000,1999,1998,1997,1996,1995,1994,1993,1992,1991,1990,1989,1988,1987,1986,1985,1984,1983,1982,1981,1980,1979,1978,1977,1976,1975,1974,1973,1972,1971,1970,1969,1968,1967,1966,1965,1964,1963,1962,1961
This statistics in other country:
AfghanistanAlbaniaAlgeriaAndorraAngolaAntigua and BarbudaArab WorldArgentinaArmeniaArubaAustraliaAustriaAzerbaijanBahamas, TheBahrainBangladeshBarbadosBelarusBelgiumBelizeBeninBermudaBhutanBoliviaBosnia and HerzegovinaBotswanaBrazilBritish Virgin IslandsBrunei DarussalamBulgariaBurkina FasoBurundiCabo VerdeCambodiaCameroonCanadaCaribbean small statesCayman IslandsCentral African RepublicCentral Europe and the BalticsChadChileChinaColombiaComorosCongo, Dem. Rep.Congo, Rep.Costa RicaCote d'IvoireCroatiaCubaCuracaoCyprusCzech RepublicDenmarkDjiboutiDominicaDominican RepublicEarly-demographic dividendEast Asia & PacificEast Asia & Pacific (excluding high income)East Asia & Pacific (IDA & IBRD countries)EcuadorEgypt, Arab Rep.El SalvadorEquatorial GuineaEritreaEstoniaEthiopiaEuro areaEurope & Central AsiaEurope & Central Asia (excluding high income)Europe & Central Asia (IDA & IBRD countries)European UnionFaroe IslandsFijiFinlandFragile and conflict affected situationsFranceFrench PolynesiaGabonGambia, TheGeorgiaGermanyGhanaGibraltarGreeceGreenlandGrenadaGuatemalaGuineaGuinea-BissauGuyanaHaitiHeavily indebted poor countries (HIPC)High incomeHondurasHong Kong SAR, ChinaHungaryIBRD onlyIcelandIDA & IBRD totalIDA blendIDA onlyIDA totalIndiaIndonesiaIran, Islamic Rep.IraqIrelandIsraelItalyJamaicaJapanJordanKazakhstanKenyaKiribatiKorea, Dem. People’s Rep.Korea, Rep.KuwaitKyrgyz RepublicLao PDRLate-demographic dividendLatin America & Caribbean Latin America & Caribbean (excluding high income)Latin America & the Caribbean (IDA & IBRD countries)LatviaLeast developed countries: UN classificationLebanonLesothoLiberiaLibyaLiechtensteinLithuaniaLow & middle incomeLow incomeLower middle incomeLuxembourgMacao SAR, ChinaMacedonia, FYRMadagascarMalawiMalaysiaMaldivesMaliMaltaMarshall IslandsMauritaniaMauritiusMexicoMicronesia, Fed. Sts.Middle East & North AfricaMiddle East & North Africa (excluding high income)Middle East & North Africa (IDA & IBRD countries)Middle incomeMoldovaMongoliaMontenegroMoroccoMozambiqueMyanmarNamibiaNauruNepalNetherlandsNew CaledoniaNew ZealandNicaraguaNigerNigeriaNorth AmericaNorwayOECD membersOmanOther small statesPacific island small statesPakistanPalauPanamaPapua New GuineaParaguayPeruPhilippinesPolandPortugalPost-demographic dividendPre-demographic dividendQatarRomaniaRussian FederationRwandaSamoaSao Tome and PrincipeSaudi ArabiaSenegalSerbiaSeychellesSierra LeoneSingaporeSint Maarten (Dutch part)Slovak RepublicSloveniaSmall statesSolomon IslandsSomaliaSouth AfricaSouth AsiaSouth Asia (IDA & IBRD)South SudanSpainSri LankaSt. Kitts and NevisSt. LuciaSt. Vincent and the GrenadinesSub-Saharan Africa Sub-Saharan Africa (excluding high income)Sub-Saharan Africa (IDA & IBRD countries)SudanSurinameSwazilandSwedenSwitzerlandSyrian Arab RepublicTajikistanTanzaniaThailandTimor-LesteTogoTongaTrinidad and TobagoTunisiaTurkeyTurkmenistanTurks and Caicos IslandsUgandaUkraineUnited Arab EmiratesUnited KingdomUnited StatesUpper middle incomeUruguayUzbekistanVanuatuVenezuela, RBVietnamWest Bank and GazaWorldYemen, Rep.ZambiaZimbabwe Timeline:
This timeline shows a graph from 1961 to 2014 of Norway. No data until 1960. Number of actual observations by date: 54.
Source name:
World Development Indicators
Source organization:
Carbon Dioxide Information Analysis Center, Environmental Sciences Division, Oak Ridge National Laboratory, Tennessee, United States.
Categories, topics:
Climate Change, Environment
Last updated:
apr 23, 2017
Indicators value changes by year
Maximum:
22.978
jan 1, 1961
At the date of observation
Value
Absolute change
Change from previous value
jan 1, 1961
22.978
+22.978
0.0%
jan 1, 1962
21.148
-1.83
-7.96%
jan 1, 1963
22.063
+0.915
4.33%
jan 1, 1964
17.964
-4.099
-18.58%
jan 1, 1965
18.052
+0.088
0.49%
jan 1, 1966
20.335
+2.283
12.65%
jan 1, 1967
16.776
-3.559
-17.5%
jan 1, 1968
16.524
-0.252
-1.5%
jan 1, 1969
15.022
-1.503
-9.09%
jan 1, 1970
16.221
+1.199
7.98%
jan 1, 1971
12.816
-3.405
-20.99%
jan 1, 1972
12.741
-0.075
-0.58%
jan 1, 1973
10.492
-2.249
-17.65%
jan 1, 1974
8.842
-1.65
-15.73%
jan 1, 1975
11.783
+2.941
33.27%
jan 1, 1976
10.121
-1.662
-14.11%
jan 1, 1977
11.607
+1.486
14.68%
jan 1, 1978
8.557
-3.051
-26.28%
jan 1, 1979
8.432
-0.125
-1.46%
jan 1, 1980
10.72
+2.288
27.13%
jan 1, 1981
10.061
-0.659
-6.15%
jan 1, 1982
8.856
-1.205
-11.97%
jan 1, 1983
8.754
-0.102
-1.15%
jan 1, 1984
9.583
+0.83
9.48%
jan 1, 1985
10.786
+1.202
12.55%
jan 1, 1986
10.925
+0.139
1.29%
jan 1, 1987
8.42
-2.505
-22.93%
jan 1, 1988
9.251
+0.831
9.87%
jan 1, 1989
8.813
-0.438
-4.74%
jan 1, 1990
7.493
-1.32
-14.98%
jan 1, 1991
10.392
+2.899
38.69%
jan 1, 1992
9.283
-1.109
-10.67%
jan 1, 1993
9.096
-0.187
-2.02%
jan 1, 1994
9.181
+0.085
0.93%
jan 1, 1995
11.043
+1.862
20.28%
jan 1, 1996
11.624
+0.581
5.27%
jan 1, 1997
11.441
-0.183
-1.58%
jan 1, 1998
10.797
-0.643
-5.62%
jan 1, 1999
10.765
-0.032
-0.3%
jan 1, 2000
9.906
-0.859
-7.98%
jan 1, 2001
10.038
+0.132
1.33%
jan 1, 2002
8.54
-1.498
-14.93%
jan 1, 2003
8.101
-0.439
-5.14%
jan 1, 2004
6.625
-1.476
-18.22%
jan 1, 2005
8.246
+1.621
24.47%
jan 1, 2006
6.947
-1.299
-15.75%
jan 1, 2007
6.098
-0.849
-12.22%
jan 1, 2008
6.775
+0.676
11.09%
jan 1, 2009
5.854
-0.921
-13.59%
jan 1, 2010
3.843
-2.011
-34.35%
jan 1, 2011
4.819
+0.976
25.41%
jan 1, 2012
7.091
+2.272
47.15%
jan 1, 2013
6.226
-0.866
-12.21%
jan 1, 2014
4.913
-1.313
-21.08%
Ranking of countries by current statistics by years


Comments: