29
/
en
AIzaSyAYiBZKx7MnpbEhh9jyipgxe19OcubqV5w
April 1, 2024
106993
Colombia
COL
true
2
1
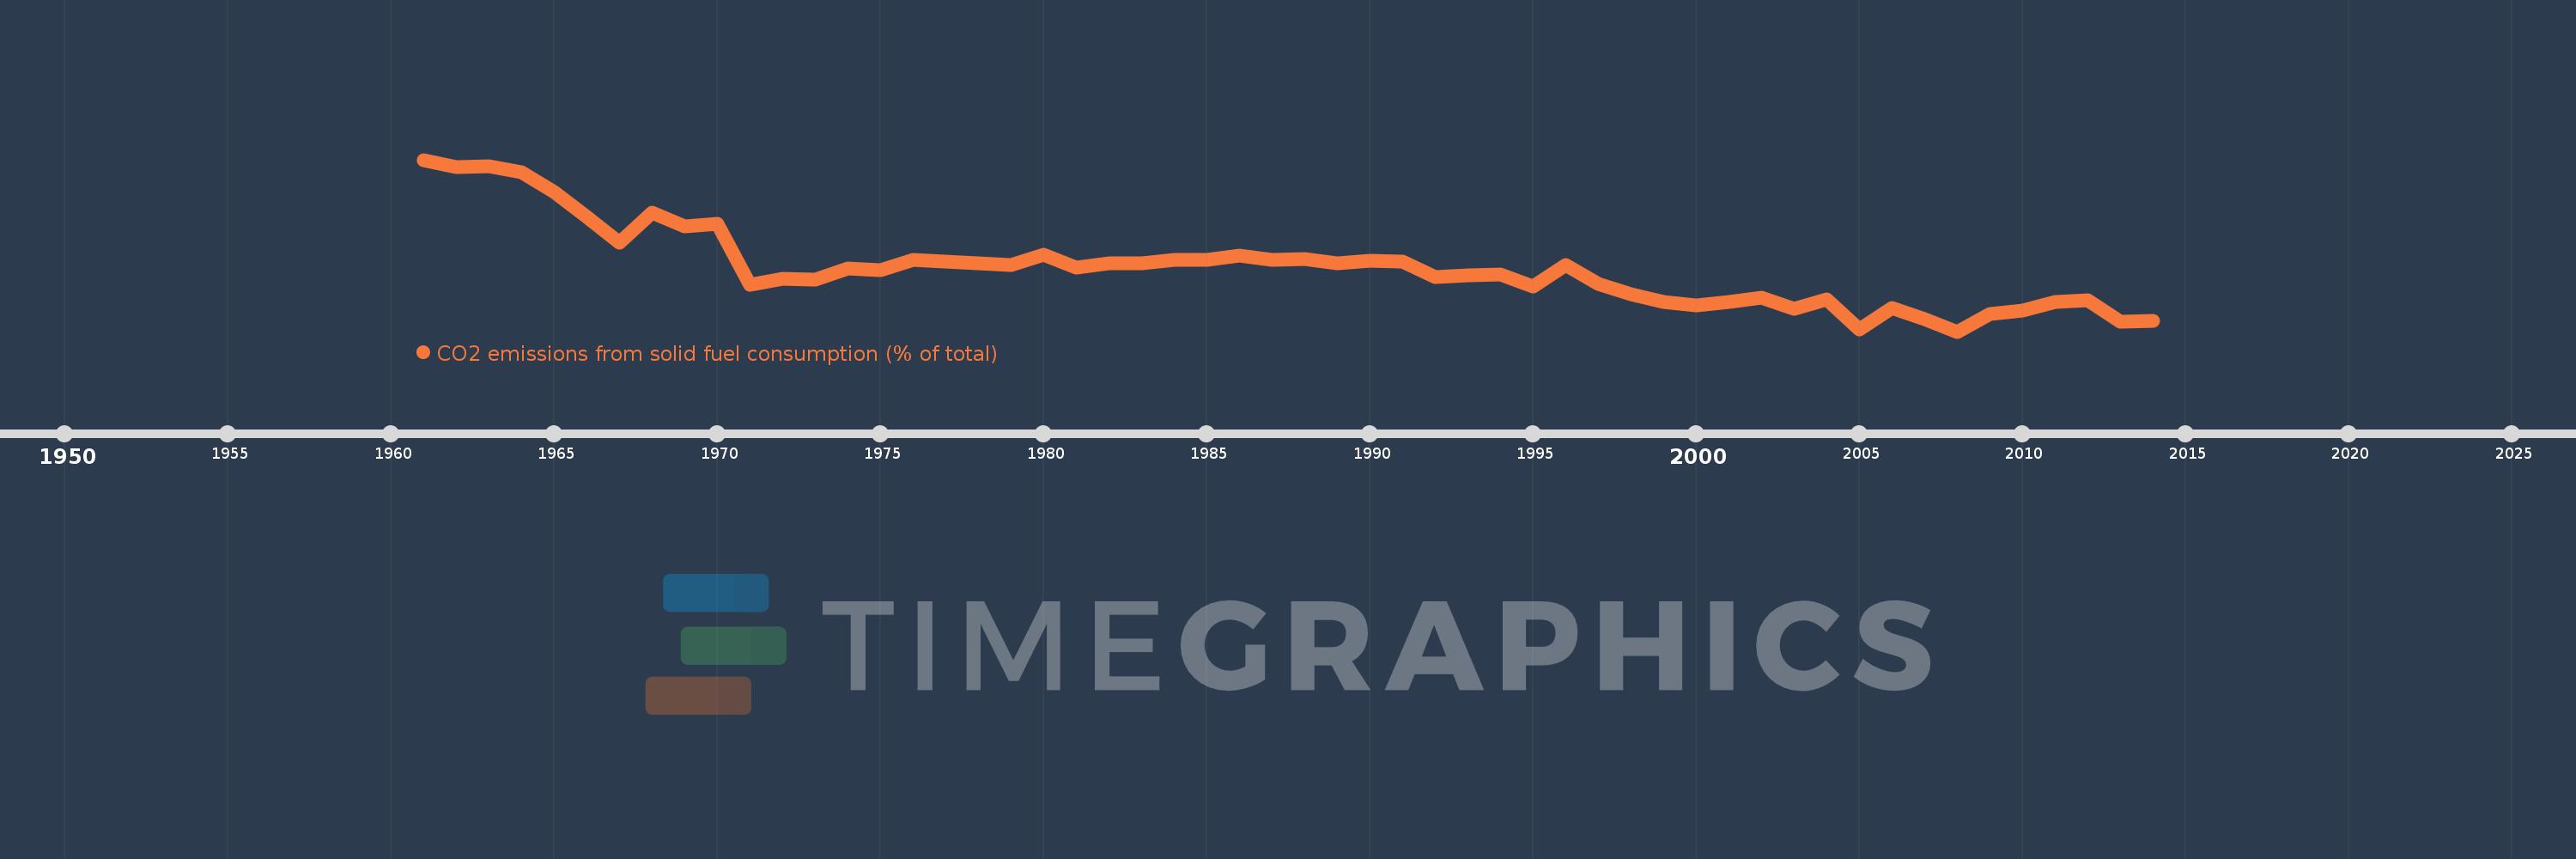
CO2 emissions from solid fuel consumption (% of total)
2014,2013,2012,2011,2010,2009,2008,2007,2006,2005,2004,2003,2002,2001,2000,1999,1998,1997,1996,1995,1994,1993,1992,1991,1990,1989,1988,1987,1986,1985,1984,1983,1982,1981,1980,1979,1978,1977,1976,1975,1974,1973,1972,1971,1970,1969,1968,1967,1966,1965,1964,1963,1962,1961
This statistics in other country:
AfghanistanAlbaniaAlgeriaAndorraAngolaAntigua and BarbudaArab WorldArgentinaArmeniaArubaAustraliaAustriaAzerbaijanBahamas, TheBahrainBangladeshBarbadosBelarusBelgiumBelizeBeninBermudaBhutanBoliviaBosnia and HerzegovinaBotswanaBrazilBritish Virgin IslandsBrunei DarussalamBulgariaBurkina FasoBurundiCabo VerdeCambodiaCameroonCanadaCaribbean small statesCayman IslandsCentral African RepublicCentral Europe and the BalticsChadChileChinaColombiaComorosCongo, Dem. Rep.Congo, Rep.Costa RicaCote d'IvoireCroatiaCubaCuracaoCyprusCzech RepublicDenmarkDjiboutiDominicaDominican RepublicEarly-demographic dividendEast Asia & PacificEast Asia & Pacific (excluding high income)East Asia & Pacific (IDA & IBRD countries)EcuadorEgypt, Arab Rep.El SalvadorEquatorial GuineaEritreaEstoniaEthiopiaEuro areaEurope & Central AsiaEurope & Central Asia (excluding high income)Europe & Central Asia (IDA & IBRD countries)European UnionFaroe IslandsFijiFinlandFragile and conflict affected situationsFranceFrench PolynesiaGabonGambia, TheGeorgiaGermanyGhanaGibraltarGreeceGreenlandGrenadaGuatemalaGuineaGuinea-BissauGuyanaHaitiHeavily indebted poor countries (HIPC)High incomeHondurasHong Kong SAR, ChinaHungaryIBRD onlyIcelandIDA & IBRD totalIDA blendIDA onlyIDA totalIndiaIndonesiaIran, Islamic Rep.IraqIrelandIsraelItalyJamaicaJapanJordanKazakhstanKenyaKiribatiKorea, Dem. People’s Rep.Korea, Rep.KuwaitKyrgyz RepublicLao PDRLate-demographic dividendLatin America & Caribbean Latin America & Caribbean (excluding high income)Latin America & the Caribbean (IDA & IBRD countries)LatviaLeast developed countries: UN classificationLebanonLesothoLiberiaLibyaLiechtensteinLithuaniaLow & middle incomeLow incomeLower middle incomeLuxembourgMacao SAR, ChinaMacedonia, FYRMadagascarMalawiMalaysiaMaldivesMaliMaltaMarshall IslandsMauritaniaMauritiusMexicoMicronesia, Fed. Sts.Middle East & North AfricaMiddle East & North Africa (excluding high income)Middle East & North Africa (IDA & IBRD countries)Middle incomeMoldovaMongoliaMontenegroMoroccoMozambiqueMyanmarNamibiaNauruNepalNetherlandsNew CaledoniaNew ZealandNicaraguaNigerNigeriaNorth AmericaNorwayOECD membersOmanOther small statesPacific island small statesPakistanPalauPanamaPapua New GuineaParaguayPeruPhilippinesPolandPortugalPost-demographic dividendPre-demographic dividendQatarRomaniaRussian FederationRwandaSamoaSao Tome and PrincipeSaudi ArabiaSenegalSerbiaSeychellesSierra LeoneSingaporeSint Maarten (Dutch part)Slovak RepublicSloveniaSmall statesSolomon IslandsSomaliaSouth AfricaSouth AsiaSouth Asia (IDA & IBRD)South SudanSpainSri LankaSt. Kitts and NevisSt. LuciaSt. Vincent and the GrenadinesSub-Saharan Africa Sub-Saharan Africa (excluding high income)Sub-Saharan Africa (IDA & IBRD countries)SudanSurinameSwazilandSwedenSwitzerlandSyrian Arab RepublicTajikistanTanzaniaThailandTimor-LesteTogoTongaTrinidad and TobagoTunisiaTurkeyTurkmenistanTurks and Caicos IslandsUgandaUkraineUnited Arab EmiratesUnited KingdomUnited StatesUpper middle incomeUruguayUzbekistanVanuatuVenezuela, RBVietnamWest Bank and GazaWorldYemen, Rep.ZambiaZimbabwe Timeline:
This timeline shows a graph from 1961 to 2014 of Colombia. No data until 1960. Number of actual observations by date: 54.
Source name:
World Development Indicators
Source organization:
Carbon Dioxide Information Analysis Center, Environmental Sciences Division, Oak Ridge National Laboratory, Tennessee, United States.
Categories, topics:
Climate Change, Environment
Last updated:
apr 23, 2017
Indicators value changes by year
Maximum:
40.737
jan 1, 1961
At the date of observation
Value
Absolute change
Change from previous value
jan 1, 1961
40.737
+40.737
0.0%
jan 1, 1962
39.513
-1.225
-3.01%
jan 1, 1963
39.664
+0.151
0.38%
jan 1, 1964
38.675
-0.989
-2.49%
jan 1, 1965
35.524
-3.152
-8.15%
jan 1, 1966
31.453
-4.07
-11.46%
jan 1, 1967
27.337
-4.117
-13.09%
jan 1, 1968
32.226
+4.889
17.88%
jan 1, 1969
29.938
-2.288
-7.1%
jan 1, 1970
30.383
+0.445
1.49%
jan 1, 1971
20.462
-9.921
-32.65%
jan 1, 1972
21.451
+0.989
4.83%
jan 1, 1973
21.27
-0.181
-0.85%
jan 1, 1974
23.069
+1.799
8.46%
jan 1, 1975
22.799
-0.27
-1.17%
jan 1, 1976
24.476
+1.678
7.36%
jan 1, 1977
24.223
-0.254
-1.04%
jan 1, 1978
23.938
-0.285
-1.18%
jan 1, 1979
23.762
-0.176
-0.74%
jan 1, 1980
25.353
+1.591
6.7%
jan 1, 1981
23.239
-2.114
-8.34%
jan 1, 1982
24.002
+0.763
3.28%
jan 1, 1983
23.952
-0.05
-0.21%
jan 1, 1984
24.568
+0.616
2.57%
jan 1, 1985
24.511
-0.057
-0.23%
jan 1, 1986
25.256
+0.744
3.04%
jan 1, 1987
24.541
-0.715
-2.83%
jan 1, 1988
24.709
+0.169
0.69%
jan 1, 1989
23.948
-0.762
-3.08%
jan 1, 1990
24.378
+0.431
1.8%
jan 1, 1991
24.233
-0.146
-0.6%
jan 1, 1992
21.75
-2.483
-10.24%
jan 1, 1993
22.044
+0.294
1.35%
jan 1, 1994
22.206
+0.163
0.74%
jan 1, 1995
20.161
-2.046
-9.21%
jan 1, 1996
23.731
+3.571
17.71%
jan 1, 1997
20.689
-3.042
-12.82%
jan 1, 1998
18.948
-1.741
-8.42%
jan 1, 1999
17.73
-1.218
-6.43%
jan 1, 2000
17.15
-0.58
-3.27%
jan 1, 2001
17.669
+0.519
3.03%
jan 1, 2002
18.357
+0.688
3.89%
jan 1, 2003
16.661
-1.695
-9.24%
jan 1, 2004
18.137
+1.475
8.86%
jan 1, 2005
13.231
-4.906
-27.05%
jan 1, 2006
16.805
+3.574
27.01%
jan 1, 2007
14.868
-1.937
-11.52%
jan 1, 2008
12.91
-1.958
-13.17%
jan 1, 2009
15.828
+2.918
22.6%
jan 1, 2010
16.255
+0.427
2.7%
jan 1, 2011
17.703
+1.448
8.91%
jan 1, 2012
18.026
+0.322
1.82%
jan 1, 2013
14.461
-3.564
-19.77%
jan 1, 2014
14.652
+0.19
1.31%
Ranking of countries by current statistics by years


Comments: