29
/
en
AIzaSyAYiBZKx7MnpbEhh9jyipgxe19OcubqV5w
April 1, 2024
260635
Tanzania
TZA
true
2
1
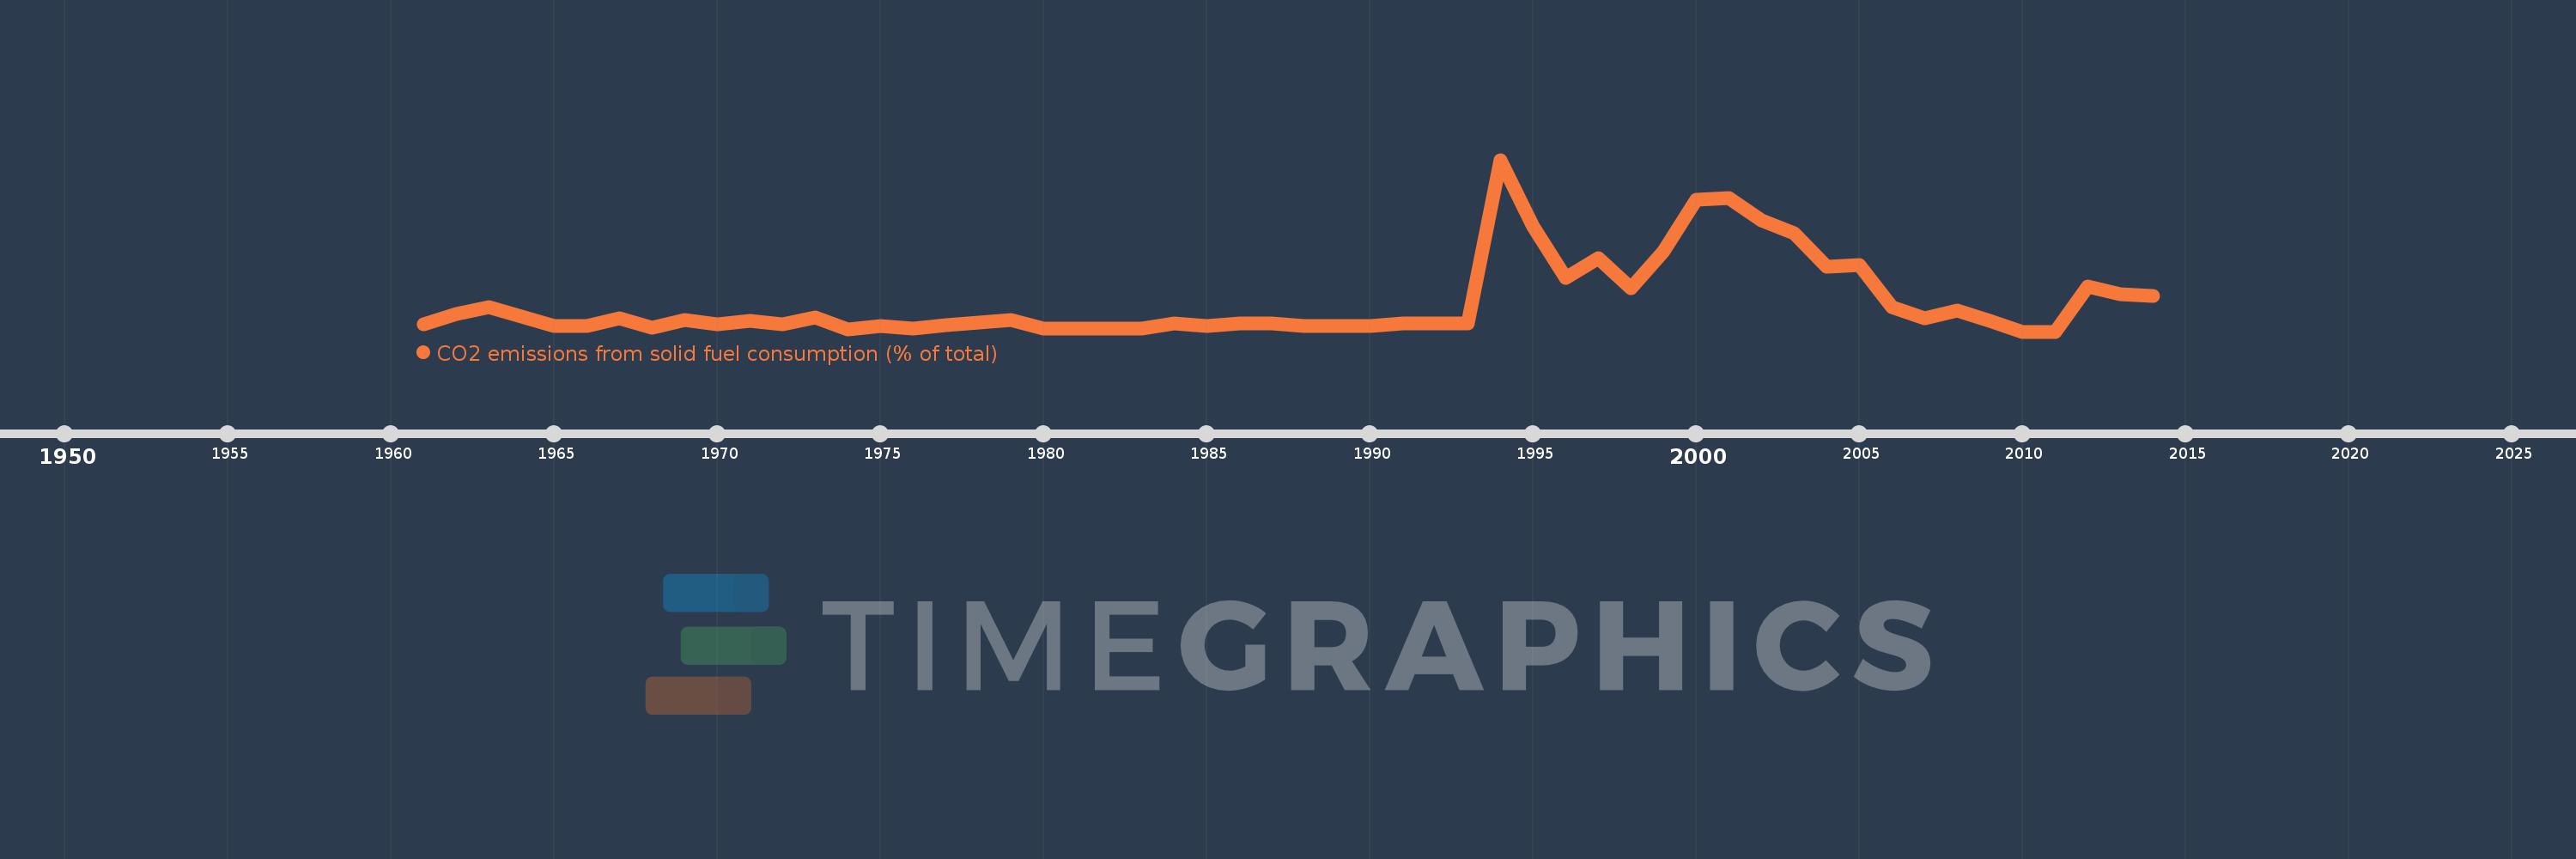
CO2 emissions from solid fuel consumption (% of total)
2014,2013,2012,2011,2010,2009,2008,2007,2006,2005,2004,2003,2002,2001,2000,1999,1998,1997,1996,1995,1994,1993,1992,1991,1990,1989,1988,1987,1986,1985,1984,1983,1982,1981,1980,1979,1978,1977,1976,1975,1974,1973,1972,1971,1970,1969,1968,1967,1966,1965,1964,1963,1962,1961
This statistics in other country:
AfghanistanAlbaniaAlgeriaAndorraAngolaAntigua and BarbudaArab WorldArgentinaArmeniaArubaAustraliaAustriaAzerbaijanBahamas, TheBahrainBangladeshBarbadosBelarusBelgiumBelizeBeninBermudaBhutanBoliviaBosnia and HerzegovinaBotswanaBrazilBritish Virgin IslandsBrunei DarussalamBulgariaBurkina FasoBurundiCabo VerdeCambodiaCameroonCanadaCaribbean small statesCayman IslandsCentral African RepublicCentral Europe and the BalticsChadChileChinaColombiaComorosCongo, Dem. Rep.Congo, Rep.Costa RicaCote d'IvoireCroatiaCubaCuracaoCyprusCzech RepublicDenmarkDjiboutiDominicaDominican RepublicEarly-demographic dividendEast Asia & PacificEast Asia & Pacific (excluding high income)East Asia & Pacific (IDA & IBRD countries)EcuadorEgypt, Arab Rep.El SalvadorEquatorial GuineaEritreaEstoniaEthiopiaEuro areaEurope & Central AsiaEurope & Central Asia (excluding high income)Europe & Central Asia (IDA & IBRD countries)European UnionFaroe IslandsFijiFinlandFragile and conflict affected situationsFranceFrench PolynesiaGabonGambia, TheGeorgiaGermanyGhanaGibraltarGreeceGreenlandGrenadaGuatemalaGuineaGuinea-BissauGuyanaHaitiHeavily indebted poor countries (HIPC)High incomeHondurasHong Kong SAR, ChinaHungaryIBRD onlyIcelandIDA & IBRD totalIDA blendIDA onlyIDA totalIndiaIndonesiaIran, Islamic Rep.IraqIrelandIsraelItalyJamaicaJapanJordanKazakhstanKenyaKiribatiKorea, Dem. People’s Rep.Korea, Rep.KuwaitKyrgyz RepublicLao PDRLate-demographic dividendLatin America & Caribbean Latin America & Caribbean (excluding high income)Latin America & the Caribbean (IDA & IBRD countries)LatviaLeast developed countries: UN classificationLebanonLesothoLiberiaLibyaLiechtensteinLithuaniaLow & middle incomeLow incomeLower middle incomeLuxembourgMacao SAR, ChinaMacedonia, FYRMadagascarMalawiMalaysiaMaldivesMaliMaltaMarshall IslandsMauritaniaMauritiusMexicoMicronesia, Fed. Sts.Middle East & North AfricaMiddle East & North Africa (excluding high income)Middle East & North Africa (IDA & IBRD countries)Middle incomeMoldovaMongoliaMontenegroMoroccoMozambiqueMyanmarNamibiaNauruNepalNetherlandsNew CaledoniaNew ZealandNicaraguaNigerNigeriaNorth AmericaNorwayOECD membersOmanOther small statesPacific island small statesPakistanPalauPanamaPapua New GuineaParaguayPeruPhilippinesPolandPortugalPost-demographic dividendPre-demographic dividendQatarRomaniaRussian FederationRwandaSamoaSao Tome and PrincipeSaudi ArabiaSenegalSerbiaSeychellesSierra LeoneSingaporeSint Maarten (Dutch part)Slovak RepublicSloveniaSmall statesSolomon IslandsSomaliaSouth AfricaSouth AsiaSouth Asia (IDA & IBRD)South SudanSpainSri LankaSt. Kitts and NevisSt. LuciaSt. Vincent and the GrenadinesSub-Saharan Africa Sub-Saharan Africa (excluding high income)Sub-Saharan Africa (IDA & IBRD countries)SudanSurinameSwazilandSwedenSwitzerlandSyrian Arab RepublicTajikistanTanzaniaThailandTimor-LesteTogoTongaTrinidad and TobagoTunisiaTurkeyTurkmenistanTurks and Caicos IslandsUgandaUkraineUnited Arab EmiratesUnited KingdomUnited StatesUpper middle incomeUruguayUzbekistanVanuatuVenezuela, RBVietnamWest Bank and GazaWorldYemen, Rep.ZambiaZimbabwe Timeline:
This timeline shows a graph from 1961 to 2014 of Tanzania. No data until 1960. Number of actual observations by date: 54.
Source name:
World Development Indicators
Source organization:
Carbon Dioxide Information Analysis Center, Environmental Sciences Division, Oak Ridge National Laboratory, Tennessee, United States.
Categories, topics:
Climate Change, Environment
Last updated:
apr 23, 2017
Indicators value changes by year
Maximum:
10.169
jan 1, 1994
At the date of observation
Value
Absolute change
Change from previous value
jan 1, 1961
0.442
+0.442
0.0%
jan 1, 1962
1.042
+0.599
135.42%
jan 1, 1963
1.435
+0.394
37.8%
jan 1, 1964
0.913
-0.522
-36.38%
jan 1, 1965
0.355
-0.559
-61.17%
jan 1, 1966
0.315
-0.039
-11.04%
jan 1, 1967
0.802
+0.487
154.28%
jan 1, 1968
0.208
-0.594
-74.03%
jan 1, 1969
0.665
+0.457
219.29%
jan 1, 1970
0.408
-0.257
-38.64%
jan 1, 1971
0.622
+0.214
52.49%
jan 1, 1972
0.446
-0.176
-28.27%
jan 1, 1973
0.846
+0.4
89.51%
jan 1, 1974
0.115
-0.731
-86.4%
jan 1, 1975
0.318
+0.203
176.31%
jan 1, 1976
0.161
-0.157
-49.52%
jan 1, 1977
0.394
+0.234
145.6%
jan 1, 1978
0.546
+0.152
38.62%
jan 1, 1979
0.666
+0.119
21.8%
jan 1, 1980
0.177
-0.489
-73.41%
jan 1, 1981
0.195
+0.018
9.92%
jan 1, 1982
0.173
-0.022
-11.23%
jan 1, 1983
0.169
-0.004
-2.03%
jan 1, 1984
0.496
+0.327
193.06%
jan 1, 1985
0.31
-0.186
-37.56%
jan 1, 1986
0.467
+0.157
50.7%
jan 1, 1987
0.478
+0.012
2.55%
jan 1, 1988
0.307
-0.172
-35.89%
jan 1, 1989
0.321
+0.014
4.49%
jan 1, 1990
0.332
+0.012
3.65%
jan 1, 1991
0.485
+0.153
46.12%
jan 1, 1992
0.459
-0.027
-5.5%
jan 1, 1993
0.473
+0.014
3.15%
jan 1, 1994
10.169
+9.696
2.05K%
jan 1, 1995
6.25
-3.919
-38.54%
jan 1, 1996
3.199
-3.051
-48.81%
jan 1, 1997
4.343
+1.144
35.76%
jan 1, 1998
2.545
-1.799
-41.41%
jan 1, 1999
4.735
+2.19
86.07%
jan 1, 2000
7.803
+3.069
64.82%
jan 1, 2001
7.884
+0.08
1.03%
jan 1, 2002
6.565
-1.319
-16.73%
jan 1, 2003
5.822
-0.743
-11.31%
jan 1, 2004
3.854
-1.969
-33.81%
jan 1, 2005
3.95
+0.096
2.49%
jan 1, 2006
1.466
-2.484
-62.89%
jan 1, 2007
0.791
-0.675
-46.05%
jan 1, 2008
1.244
+0.453
57.29%
jan 1, 2009
0.657
-0.587
-47.2%
jan 1, 2010
0.0
-0.657
-100.0%
jan 1, 2012
2.673
+2.673
%
jan 1, 2013
2.19
-0.484
-18.09%
jan 1, 2014
2.115
-0.075
-3.43%
Ranking of countries by current statistics by years


Comments: