29
/
en
AIzaSyAYiBZKx7MnpbEhh9jyipgxe19OcubqV5w
April 1, 2024
37209
IDA & IBRD total
IBT
false
2
1
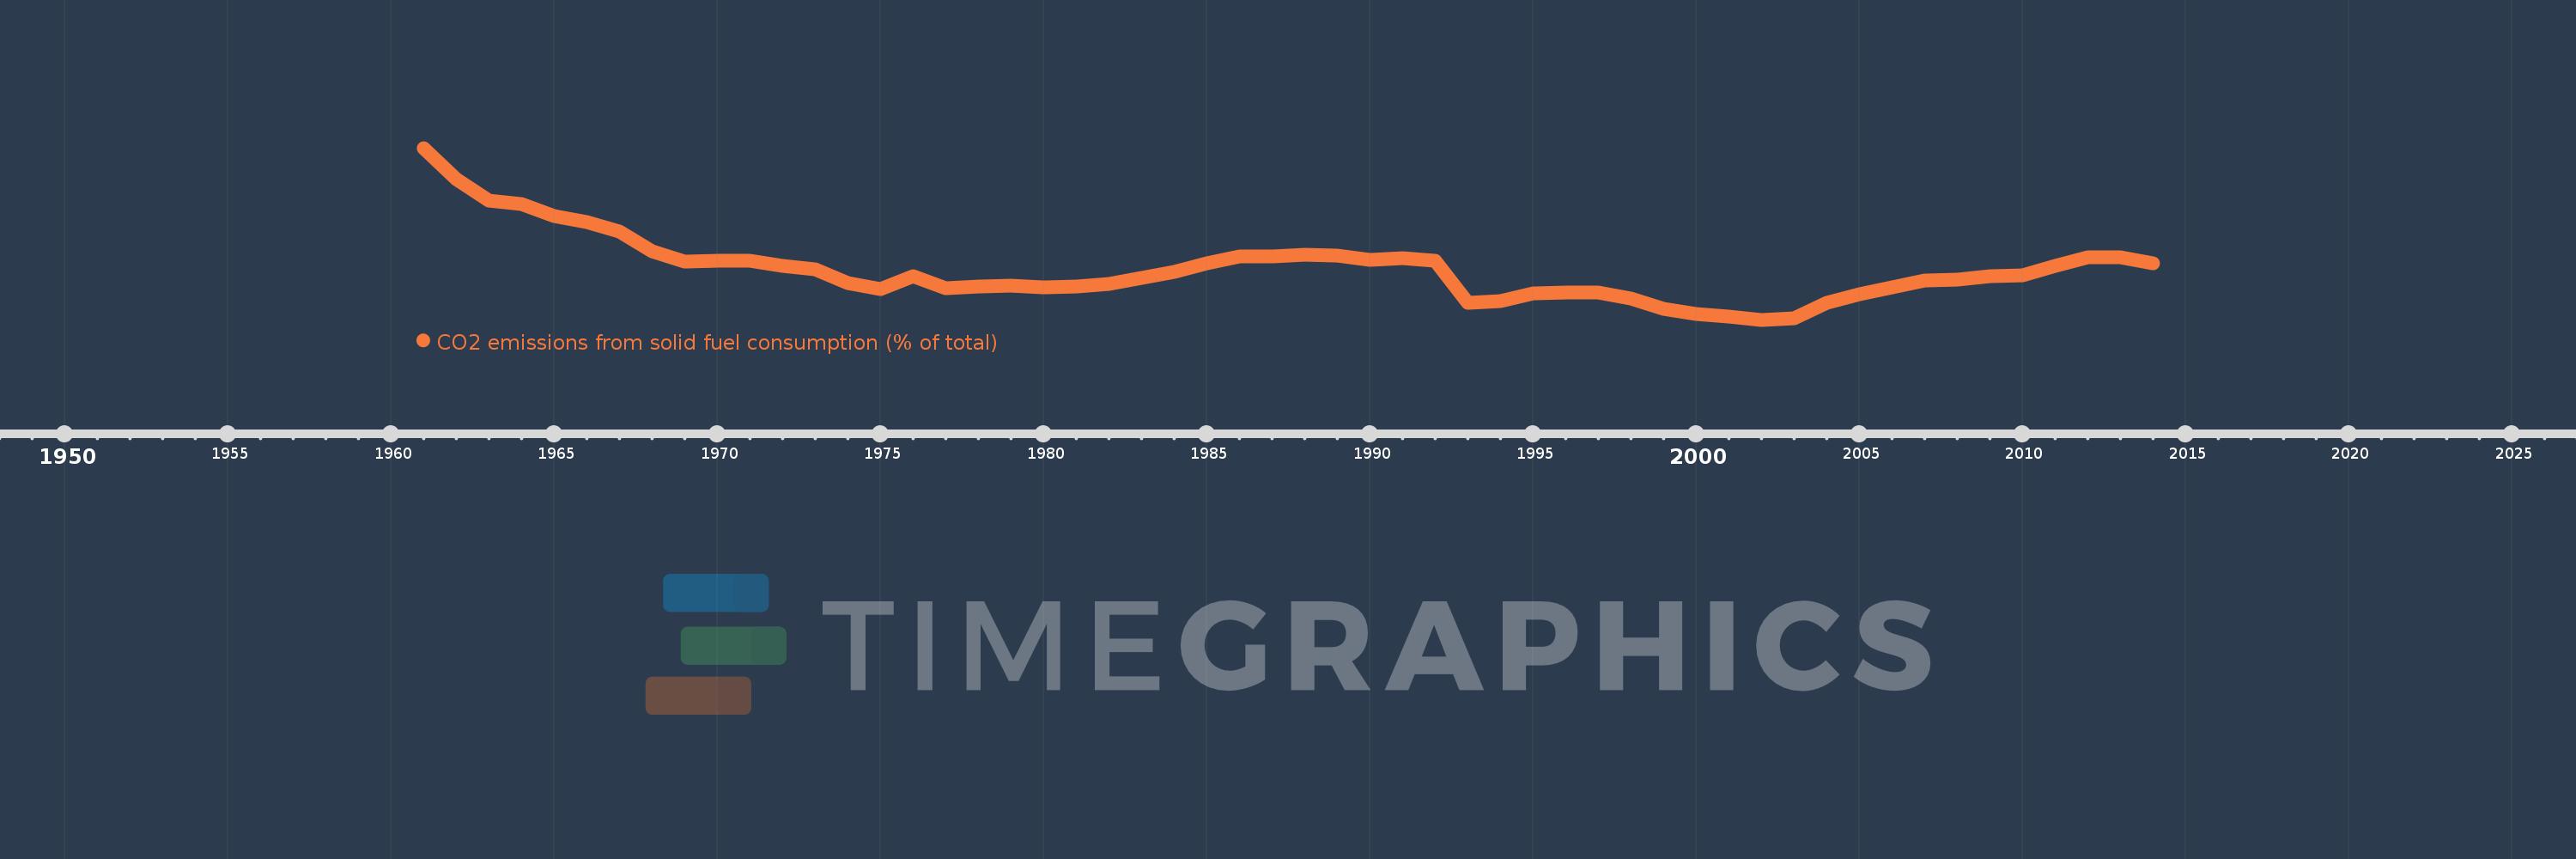
CO2 emissions from solid fuel consumption (% of total)
2014,2013,2012,2011,2010,2009,2008,2007,2006,2005,2004,2003,2002,2001,2000,1999,1998,1997,1996,1995,1994,1993,1992,1991,1990,1989,1988,1987,1986,1985,1984,1983,1982,1981,1980,1979,1978,1977,1976,1975,1974,1973,1972,1971,1970,1969,1968,1967,1966,1965,1964,1963,1962,1961
This statistics in other country:
AfghanistanAlbaniaAlgeriaAndorraAngolaAntigua and BarbudaArab WorldArgentinaArmeniaArubaAustraliaAustriaAzerbaijanBahamas, TheBahrainBangladeshBarbadosBelarusBelgiumBelizeBeninBermudaBhutanBoliviaBosnia and HerzegovinaBotswanaBrazilBritish Virgin IslandsBrunei DarussalamBulgariaBurkina FasoBurundiCabo VerdeCambodiaCameroonCanadaCaribbean small statesCayman IslandsCentral African RepublicCentral Europe and the BalticsChadChileChinaColombiaComorosCongo, Dem. Rep.Congo, Rep.Costa RicaCote d'IvoireCroatiaCubaCuracaoCyprusCzech RepublicDenmarkDjiboutiDominicaDominican RepublicEarly-demographic dividendEast Asia & PacificEast Asia & Pacific (excluding high income)East Asia & Pacific (IDA & IBRD countries)EcuadorEgypt, Arab Rep.El SalvadorEquatorial GuineaEritreaEstoniaEthiopiaEuro areaEurope & Central AsiaEurope & Central Asia (excluding high income)Europe & Central Asia (IDA & IBRD countries)European UnionFaroe IslandsFijiFinlandFragile and conflict affected situationsFranceFrench PolynesiaGabonGambia, TheGeorgiaGermanyGhanaGibraltarGreeceGreenlandGrenadaGuatemalaGuineaGuinea-BissauGuyanaHaitiHeavily indebted poor countries (HIPC)High incomeHondurasHong Kong SAR, ChinaHungaryIBRD onlyIcelandIDA & IBRD totalIDA blendIDA onlyIDA totalIndiaIndonesiaIran, Islamic Rep.IraqIrelandIsraelItalyJamaicaJapanJordanKazakhstanKenyaKiribatiKorea, Dem. People’s Rep.Korea, Rep.KuwaitKyrgyz RepublicLao PDRLate-demographic dividendLatin America & Caribbean Latin America & Caribbean (excluding high income)Latin America & the Caribbean (IDA & IBRD countries)LatviaLeast developed countries: UN classificationLebanonLesothoLiberiaLibyaLiechtensteinLithuaniaLow & middle incomeLow incomeLower middle incomeLuxembourgMacao SAR, ChinaMacedonia, FYRMadagascarMalawiMalaysiaMaldivesMaliMaltaMarshall IslandsMauritaniaMauritiusMexicoMicronesia, Fed. Sts.Middle East & North AfricaMiddle East & North Africa (excluding high income)Middle East & North Africa (IDA & IBRD countries)Middle incomeMoldovaMongoliaMontenegroMoroccoMozambiqueMyanmarNamibiaNauruNepalNetherlandsNew CaledoniaNew ZealandNicaraguaNigerNigeriaNorth AmericaNorwayOECD membersOmanOther small statesPacific island small statesPakistanPalauPanamaPapua New GuineaParaguayPeruPhilippinesPolandPortugalPost-demographic dividendPre-demographic dividendQatarRomaniaRussian FederationRwandaSamoaSao Tome and PrincipeSaudi ArabiaSenegalSerbiaSeychellesSierra LeoneSingaporeSint Maarten (Dutch part)Slovak RepublicSloveniaSmall statesSolomon IslandsSomaliaSouth AfricaSouth AsiaSouth Asia (IDA & IBRD)South SudanSpainSri LankaSt. Kitts and NevisSt. LuciaSt. Vincent and the GrenadinesSub-Saharan Africa Sub-Saharan Africa (excluding high income)Sub-Saharan Africa (IDA & IBRD countries)SudanSurinameSwazilandSwedenSwitzerlandSyrian Arab RepublicTajikistanTanzaniaThailandTimor-LesteTogoTongaTrinidad and TobagoTunisiaTurkeyTurkmenistanTurks and Caicos IslandsUgandaUkraineUnited Arab EmiratesUnited KingdomUnited StatesUpper middle incomeUruguayUzbekistanVanuatuVenezuela, RBVietnamWest Bank and GazaWorldYemen, Rep.ZambiaZimbabwe Timeline:
This timeline shows a graph from 1961 to 2014 of IDA & IBRD total. No data until 1960. Number of actual observations by date: 54.
Source name:
World Development Indicators
Source organization:
Carbon Dioxide Information Analysis Center, Environmental Sciences Division, Oak Ridge National Laboratory, Tennessee, United States.
Categories, topics:
Climate Change, Environment
Last updated:
apr 23, 2017
Indicators value changes by year
Minimum:
42.563
jan 1, 2002
At the date of observation
Value
Absolute change
Change from previous value
jan 1, 1961
70.2
+70.2
0.0%
jan 1, 1962
65.157
-5.044
-7.18%
jan 1, 1963
61.7
-3.456
-5.3%
jan 1, 1964
61.179
-0.521
-0.84%
jan 1, 1965
59.232
-1.947
-3.18%
jan 1, 1966
58.251
-0.981
-1.66%
jan 1, 1967
56.744
-1.507
-2.59%
jan 1, 1968
53.508
-3.236
-5.7%
jan 1, 1969
51.882
-1.627
-3.04%
jan 1, 1970
52.065
+0.184
0.35%
jan 1, 1971
52.008
-0.057
-0.11%
jan 1, 1972
51.245
-0.763
-1.47%
jan 1, 1973
50.66
-0.585
-1.14%
jan 1, 1974
48.502
-2.158
-4.26%
jan 1, 1975
47.503
-1.0
-2.06%
jan 1, 1976
49.531
+2.028
4.27%
jan 1, 1977
47.61
-1.92
-3.88%
jan 1, 1978
47.965
+0.355
0.74%
jan 1, 1979
47.982
+0.017
0.04%
jan 1, 1980
47.808
-0.174
-0.36%
jan 1, 1981
47.941
+0.134
0.28%
jan 1, 1982
48.371
+0.429
0.9%
jan 1, 1983
49.34
+0.969
2.0%
jan 1, 1984
50.306
+0.966
1.96%
jan 1, 1985
51.656
+1.349
2.68%
jan 1, 1986
52.696
+1.04
2.01%
jan 1, 1987
52.752
+0.056
0.11%
jan 1, 1988
53.037
+0.285
0.54%
jan 1, 1989
52.902
-0.135
-0.25%
jan 1, 1990
52.15
-0.752
-1.42%
jan 1, 1991
52.408
+0.258
0.49%
jan 1, 1992
52.118
-0.291
-0.55%
jan 1, 1993
45.33
-6.787
-13.02%
jan 1, 1994
45.614
+0.284
0.63%
jan 1, 1995
46.737
+1.123
2.46%
jan 1, 1996
46.995
+0.257
0.55%
jan 1, 1997
46.92
-0.074
-0.16%
jan 1, 1998
45.965
-0.955
-2.04%
jan 1, 1999
44.368
-1.597
-3.47%
jan 1, 2000
43.501
-0.867
-1.95%
jan 1, 2001
43.045
-0.456
-1.05%
jan 1, 2002
42.563
-0.482
-1.12%
jan 1, 2003
42.826
+0.262
0.62%
jan 1, 2004
45.321
+2.496
5.83%
jan 1, 2005
46.678
+1.357
2.99%
jan 1, 2006
47.781
+1.102
2.36%
jan 1, 2007
48.822
+1.041
2.18%
jan 1, 2008
48.972
+0.15
0.31%
jan 1, 2009
49.59
+0.618
1.26%
jan 1, 2010
49.714
+0.124
0.25%
jan 1, 2011
51.215
+1.5
3.02%
jan 1, 2012
52.625
+1.411
2.75%
jan 1, 2013
52.608
-0.017
-0.03%
jan 1, 2014
51.669
-0.94
-1.79%
Ranking of countries by current statistics by years


Comments: