29
/
en
AIzaSyAYiBZKx7MnpbEhh9jyipgxe19OcubqV5w
April 1, 2024
228235
Romania
ROU
true
2
1
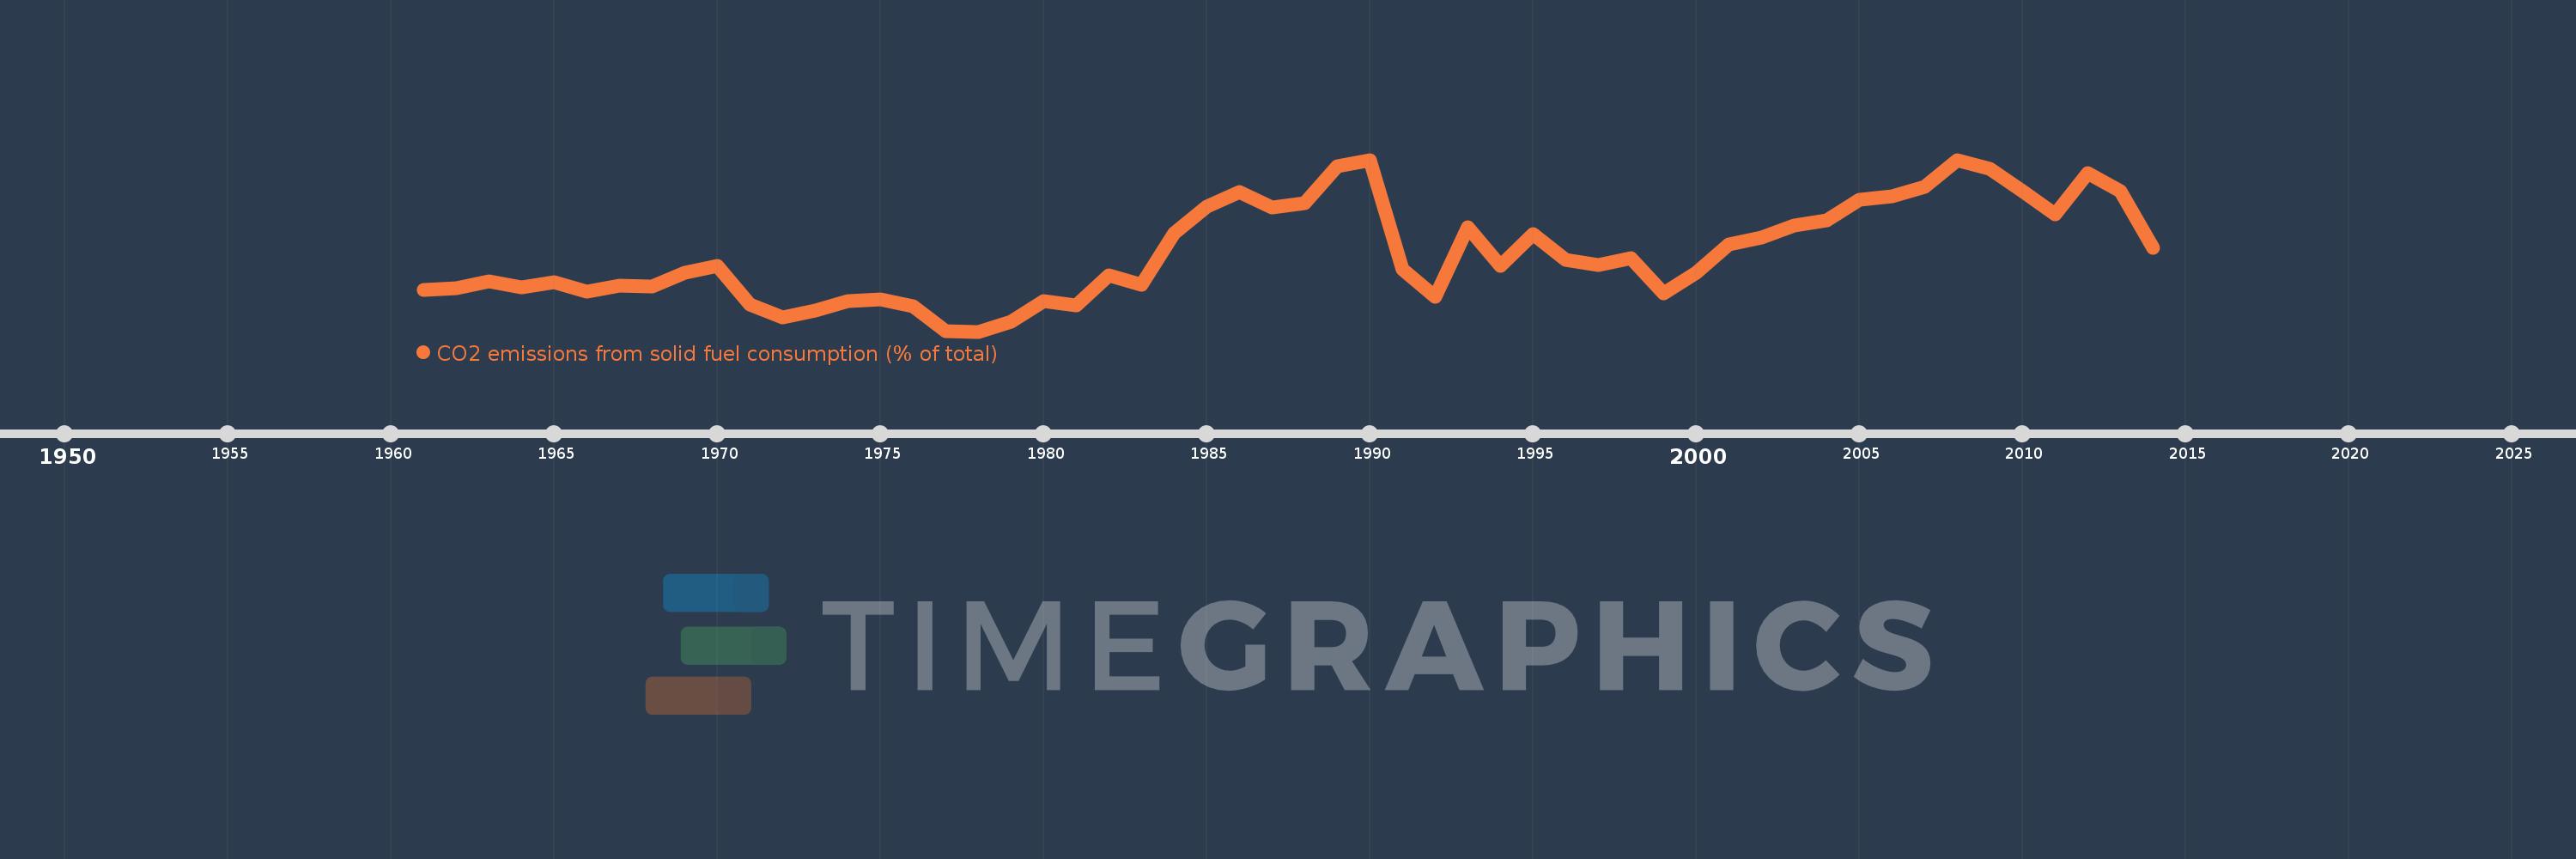
CO2 emissions from solid fuel consumption (% of total)
2014,2013,2012,2011,2010,2009,2008,2007,2006,2005,2004,2003,2002,2001,2000,1999,1998,1997,1996,1995,1994,1993,1992,1991,1990,1989,1988,1987,1986,1985,1984,1983,1982,1981,1980,1979,1978,1977,1976,1975,1974,1973,1972,1971,1970,1969,1968,1967,1966,1965,1964,1963,1962,1961
This statistics in other country:
AfghanistanAlbaniaAlgeriaAndorraAngolaAntigua and BarbudaArab WorldArgentinaArmeniaArubaAustraliaAustriaAzerbaijanBahamas, TheBahrainBangladeshBarbadosBelarusBelgiumBelizeBeninBermudaBhutanBoliviaBosnia and HerzegovinaBotswanaBrazilBritish Virgin IslandsBrunei DarussalamBulgariaBurkina FasoBurundiCabo VerdeCambodiaCameroonCanadaCaribbean small statesCayman IslandsCentral African RepublicCentral Europe and the BalticsChadChileChinaColombiaComorosCongo, Dem. Rep.Congo, Rep.Costa RicaCote d'IvoireCroatiaCubaCuracaoCyprusCzech RepublicDenmarkDjiboutiDominicaDominican RepublicEarly-demographic dividendEast Asia & PacificEast Asia & Pacific (excluding high income)East Asia & Pacific (IDA & IBRD countries)EcuadorEgypt, Arab Rep.El SalvadorEquatorial GuineaEritreaEstoniaEthiopiaEuro areaEurope & Central AsiaEurope & Central Asia (excluding high income)Europe & Central Asia (IDA & IBRD countries)European UnionFaroe IslandsFijiFinlandFragile and conflict affected situationsFranceFrench PolynesiaGabonGambia, TheGeorgiaGermanyGhanaGibraltarGreeceGreenlandGrenadaGuatemalaGuineaGuinea-BissauGuyanaHaitiHeavily indebted poor countries (HIPC)High incomeHondurasHong Kong SAR, ChinaHungaryIBRD onlyIcelandIDA & IBRD totalIDA blendIDA onlyIDA totalIndiaIndonesiaIran, Islamic Rep.IraqIrelandIsraelItalyJamaicaJapanJordanKazakhstanKenyaKiribatiKorea, Dem. People’s Rep.Korea, Rep.KuwaitKyrgyz RepublicLao PDRLate-demographic dividendLatin America & Caribbean Latin America & Caribbean (excluding high income)Latin America & the Caribbean (IDA & IBRD countries)LatviaLeast developed countries: UN classificationLebanonLesothoLiberiaLibyaLiechtensteinLithuaniaLow & middle incomeLow incomeLower middle incomeLuxembourgMacao SAR, ChinaMacedonia, FYRMadagascarMalawiMalaysiaMaldivesMaliMaltaMarshall IslandsMauritaniaMauritiusMexicoMicronesia, Fed. Sts.Middle East & North AfricaMiddle East & North Africa (excluding high income)Middle East & North Africa (IDA & IBRD countries)Middle incomeMoldovaMongoliaMontenegroMoroccoMozambiqueMyanmarNamibiaNauruNepalNetherlandsNew CaledoniaNew ZealandNicaraguaNigerNigeriaNorth AmericaNorwayOECD membersOmanOther small statesPacific island small statesPakistanPalauPanamaPapua New GuineaParaguayPeruPhilippinesPolandPortugalPost-demographic dividendPre-demographic dividendQatarRomaniaRussian FederationRwandaSamoaSao Tome and PrincipeSaudi ArabiaSenegalSerbiaSeychellesSierra LeoneSingaporeSint Maarten (Dutch part)Slovak RepublicSloveniaSmall statesSolomon IslandsSomaliaSouth AfricaSouth AsiaSouth Asia (IDA & IBRD)South SudanSpainSri LankaSt. Kitts and NevisSt. LuciaSt. Vincent and the GrenadinesSub-Saharan Africa Sub-Saharan Africa (excluding high income)Sub-Saharan Africa (IDA & IBRD countries)SudanSurinameSwazilandSwedenSwitzerlandSyrian Arab RepublicTajikistanTanzaniaThailandTimor-LesteTogoTongaTrinidad and TobagoTunisiaTurkeyTurkmenistanTurks and Caicos IslandsUgandaUkraineUnited Arab EmiratesUnited KingdomUnited StatesUpper middle incomeUruguayUzbekistanVanuatuVenezuela, RBVietnamWest Bank and GazaWorldYemen, Rep.ZambiaZimbabwe Timeline:
This timeline shows a graph from 1961 to 2014 of Romania. No data until 1960. Number of actual observations by date: 54.
Source name:
World Development Indicators
Source organization:
Carbon Dioxide Information Analysis Center, Environmental Sciences Division, Oak Ridge National Laboratory, Tennessee, United States.
Categories, topics:
Climate Change, Environment
Last updated:
apr 23, 2017
Indicators value changes by year
Minimum:
25.083
jan 1, 1978
Maximum:
39.063
jan 1, 2008
At the date of observation
Value
Absolute change
Change from previous value
jan 1, 1961
28.444
+28.444
0.0%
jan 1, 1962
28.632
+0.188
0.66%
jan 1, 1963
29.168
+0.535
1.87%
jan 1, 1964
28.717
-0.451
-1.55%
jan 1, 1965
29.081
+0.364
1.27%
jan 1, 1966
28.335
-0.745
-2.56%
jan 1, 1967
28.837
+0.501
1.77%
jan 1, 1968
28.73
-0.107
-0.37%
jan 1, 1969
29.859
+1.129
3.93%
jan 1, 1970
30.407
+0.548
1.84%
jan 1, 1971
27.26
-3.147
-10.35%
jan 1, 1972
26.234
-1.026
-3.76%
jan 1, 1973
26.772
+0.538
2.05%
jan 1, 1974
27.573
+0.801
2.99%
jan 1, 1975
27.687
+0.114
0.41%
jan 1, 1976
27.133
-0.554
-2.0%
jan 1, 1977
25.103
-2.03
-7.48%
jan 1, 1978
25.083
-0.02
-0.08%
jan 1, 1979
25.907
+0.824
3.28%
jan 1, 1980
27.563
+1.656
6.39%
jan 1, 1981
27.233
-0.33
-1.2%
jan 1, 1982
29.639
+2.406
8.83%
jan 1, 1983
28.915
-0.724
-2.44%
jan 1, 1984
33.088
+4.173
14.43%
jan 1, 1985
35.288
+2.2
6.65%
jan 1, 1986
36.462
+1.174
3.33%
jan 1, 1987
35.196
-1.266
-3.47%
jan 1, 1988
35.527
+0.331
0.94%
jan 1, 1989
38.523
+2.996
8.43%
jan 1, 1990
39.059
+0.535
1.39%
jan 1, 1991
30.149
-8.91
-22.81%
jan 1, 1992
27.911
-2.238
-7.42%
jan 1, 1993
33.575
+5.664
20.29%
jan 1, 1994
30.403
-3.173
-9.45%
jan 1, 1995
32.992
+2.59
8.52%
jan 1, 1996
30.922
-2.07
-6.27%
jan 1, 1997
30.487
-0.435
-1.41%
jan 1, 1998
31.067
+0.58
1.9%
jan 1, 1999
28.197
-2.87
-9.24%
jan 1, 2000
29.855
+1.658
5.88%
jan 1, 2001
32.165
+2.31
7.74%
jan 1, 2002
32.741
+0.577
1.79%
jan 1, 2003
33.71
+0.969
2.96%
jan 1, 2004
34.133
+0.422
1.25%
jan 1, 2005
35.802
+1.669
4.89%
jan 1, 2006
36.071
+0.269
0.75%
jan 1, 2007
36.84
+0.769
2.13%
jan 1, 2008
39.063
+2.223
6.03%
jan 1, 2009
38.332
-0.731
-1.87%
jan 1, 2010
36.502
-1.83
-4.77%
jan 1, 2011
34.636
-1.866
-5.11%
jan 1, 2012
37.982
+3.346
9.66%
jan 1, 2013
36.53
-1.453
-3.82%
jan 1, 2014
31.897
-4.632
-12.68%
Ranking of countries by current statistics by years


Comments: