29
/
en
AIzaSyAYiBZKx7MnpbEhh9jyipgxe19OcubqV5w
April 1, 2024
160296
Israel
ISR
true
2
1
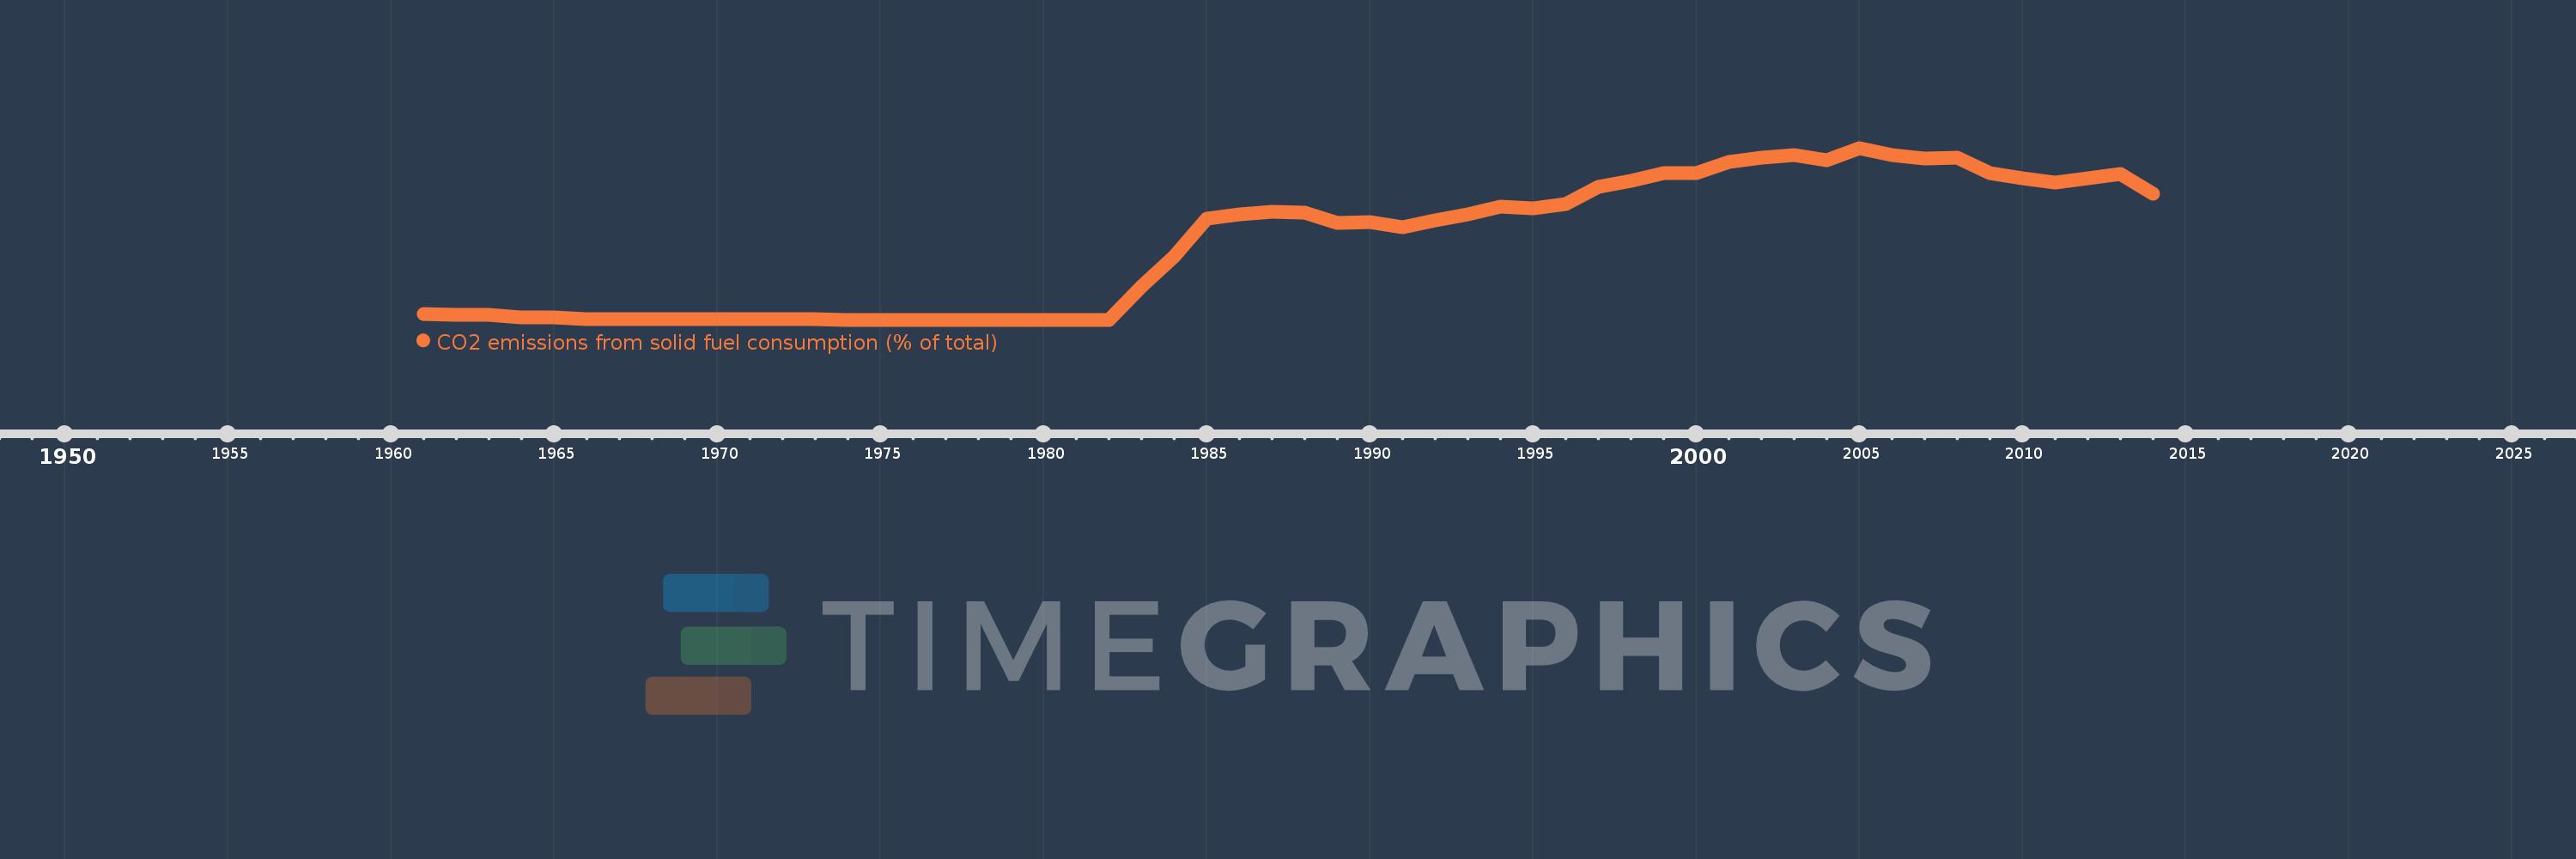
CO2 emissions from solid fuel consumption (% of total)
2014,2013,2012,2011,2010,2009,2008,2007,2006,2005,2004,2003,2002,2001,2000,1999,1998,1997,1996,1995,1994,1993,1992,1991,1990,1989,1988,1987,1986,1985,1984,1983,1982,1981,1980,1979,1978,1977,1976,1975,1974,1973,1972,1971,1970,1969,1968,1967,1966,1965,1964,1963,1962,1961
This statistics in other country:
AfghanistanAlbaniaAlgeriaAndorraAngolaAntigua and BarbudaArab WorldArgentinaArmeniaArubaAustraliaAustriaAzerbaijanBahamas, TheBahrainBangladeshBarbadosBelarusBelgiumBelizeBeninBermudaBhutanBoliviaBosnia and HerzegovinaBotswanaBrazilBritish Virgin IslandsBrunei DarussalamBulgariaBurkina FasoBurundiCabo VerdeCambodiaCameroonCanadaCaribbean small statesCayman IslandsCentral African RepublicCentral Europe and the BalticsChadChileChinaColombiaComorosCongo, Dem. Rep.Congo, Rep.Costa RicaCote d'IvoireCroatiaCubaCuracaoCyprusCzech RepublicDenmarkDjiboutiDominicaDominican RepublicEarly-demographic dividendEast Asia & PacificEast Asia & Pacific (excluding high income)East Asia & Pacific (IDA & IBRD countries)EcuadorEgypt, Arab Rep.El SalvadorEquatorial GuineaEritreaEstoniaEthiopiaEuro areaEurope & Central AsiaEurope & Central Asia (excluding high income)Europe & Central Asia (IDA & IBRD countries)European UnionFaroe IslandsFijiFinlandFragile and conflict affected situationsFranceFrench PolynesiaGabonGambia, TheGeorgiaGermanyGhanaGibraltarGreeceGreenlandGrenadaGuatemalaGuineaGuinea-BissauGuyanaHaitiHeavily indebted poor countries (HIPC)High incomeHondurasHong Kong SAR, ChinaHungaryIBRD onlyIcelandIDA & IBRD totalIDA blendIDA onlyIDA totalIndiaIndonesiaIran, Islamic Rep.IraqIrelandIsraelItalyJamaicaJapanJordanKazakhstanKenyaKiribatiKorea, Dem. People’s Rep.Korea, Rep.KuwaitKyrgyz RepublicLao PDRLate-demographic dividendLatin America & Caribbean Latin America & Caribbean (excluding high income)Latin America & the Caribbean (IDA & IBRD countries)LatviaLeast developed countries: UN classificationLebanonLesothoLiberiaLibyaLiechtensteinLithuaniaLow & middle incomeLow incomeLower middle incomeLuxembourgMacao SAR, ChinaMacedonia, FYRMadagascarMalawiMalaysiaMaldivesMaliMaltaMarshall IslandsMauritaniaMauritiusMexicoMicronesia, Fed. Sts.Middle East & North AfricaMiddle East & North Africa (excluding high income)Middle East & North Africa (IDA & IBRD countries)Middle incomeMoldovaMongoliaMontenegroMoroccoMozambiqueMyanmarNamibiaNauruNepalNetherlandsNew CaledoniaNew ZealandNicaraguaNigerNigeriaNorth AmericaNorwayOECD membersOmanOther small statesPacific island small statesPakistanPalauPanamaPapua New GuineaParaguayPeruPhilippinesPolandPortugalPost-demographic dividendPre-demographic dividendQatarRomaniaRussian FederationRwandaSamoaSao Tome and PrincipeSaudi ArabiaSenegalSerbiaSeychellesSierra LeoneSingaporeSint Maarten (Dutch part)Slovak RepublicSloveniaSmall statesSolomon IslandsSomaliaSouth AfricaSouth AsiaSouth Asia (IDA & IBRD)South SudanSpainSri LankaSt. Kitts and NevisSt. LuciaSt. Vincent and the GrenadinesSub-Saharan Africa Sub-Saharan Africa (excluding high income)Sub-Saharan Africa (IDA & IBRD countries)SudanSurinameSwazilandSwedenSwitzerlandSyrian Arab RepublicTajikistanTanzaniaThailandTimor-LesteTogoTongaTrinidad and TobagoTunisiaTurkeyTurkmenistanTurks and Caicos IslandsUgandaUkraineUnited Arab EmiratesUnited KingdomUnited StatesUpper middle incomeUruguayUzbekistanVanuatuVenezuela, RBVietnamWest Bank and GazaWorldYemen, Rep.ZambiaZimbabwe Timeline:
This timeline shows a graph from 1961 to 2014 of Israel. No data until 1960. Number of actual observations by date: 54.
Source name:
World Development Indicators
Source organization:
Carbon Dioxide Information Analysis Center, Environmental Sciences Division, Oak Ridge National Laboratory, Tennessee, United States.
Categories, topics:
Climate Change, Environment
Last updated:
apr 23, 2017
Indicators value changes by year
Maximum:
50.947
jan 1, 2005
At the date of observation
Value
Absolute change
Change from previous value
jan 1, 1961
1.871
+1.871
0.0%
jan 1, 1962
1.608
-0.263
-14.05%
jan 1, 1963
1.477
-0.131
-8.12%
jan 1, 1964
0.67
-0.807
-54.65%
jan 1, 1965
0.802
+0.132
19.65%
jan 1, 1966
0.17
-0.632
-78.8%
jan 1, 1967
0.135
-0.035
-20.67%
jan 1, 1968
0.135
+0.001
0.41%
jan 1, 1969
0.186
+0.05
37.29%
jan 1, 1970
0.173
-0.013
-6.81%
jan 1, 1971
0.111
-0.063
-36.16%
jan 1, 1972
0.135
+0.025
22.44%
jan 1, 1973
0.108
-0.027
-20.04%
jan 1, 1974
0.057
-0.051
-47.38%
jan 1, 1975
0.057
0.0
-0.7%
jan 1, 1976
0.075
+0.018
31.96%
jan 1, 1977
0.075
+0.0
0.19%
jan 1, 1978
0.074
-0.001
-1.42%
jan 1, 1979
0.069
-0.004
-6.06%
jan 1, 1980
0.07
+0.001
0.75%
jan 1, 1981
0.069
0.0
-0.61%
jan 1, 1982
0.069
0.0
-0.31%
jan 1, 1983
10.005
+9.935
14.37K%
jan 1, 1984
18.689
+8.684
86.8%
jan 1, 1985
30.008
+11.319
60.57%
jan 1, 1986
31.318
+1.31
4.37%
jan 1, 1987
32.089
+0.771
2.46%
jan 1, 1988
31.668
-0.421
-1.31%
jan 1, 1989
28.774
-2.895
-9.14%
jan 1, 1990
29.018
+0.245
0.85%
jan 1, 1991
27.44
-1.579
-5.44%
jan 1, 1992
29.572
+2.132
7.77%
jan 1, 1993
31.271
+1.699
5.74%
jan 1, 1994
33.55
+2.279
7.29%
jan 1, 1995
33.116
-0.434
-1.29%
jan 1, 1996
34.374
+1.258
3.8%
jan 1, 1997
39.406
+5.032
14.64%
jan 1, 1998
41.276
+1.87
4.74%
jan 1, 1999
43.455
+2.18
5.28%
jan 1, 2000
43.501
+0.046
0.11%
jan 1, 2001
46.839
+3.337
7.67%
jan 1, 2002
48.129
+1.29
2.75%
jan 1, 2003
48.955
+0.826
1.72%
jan 1, 2004
47.306
-1.649
-3.37%
jan 1, 2005
50.947
+3.641
7.7%
jan 1, 2006
48.896
-2.052
-4.03%
jan 1, 2007
47.934
-0.962
-1.97%
jan 1, 2008
48.093
+0.159
0.33%
jan 1, 2009
43.371
-4.722
-9.82%
jan 1, 2010
42.051
-1.32
-3.04%
jan 1, 2011
40.785
-1.266
-3.01%
jan 1, 2012
41.985
+1.2
2.94%
jan 1, 2013
43.166
+1.182
2.81%
jan 1, 2014
37.375
-5.792
-13.42%
Ranking of countries by current statistics by years


Comments: