29
/
en
AIzaSyAYiBZKx7MnpbEhh9jyipgxe19OcubqV5w
April 1, 2024
216158
Pakistan
PAK
true
2
1
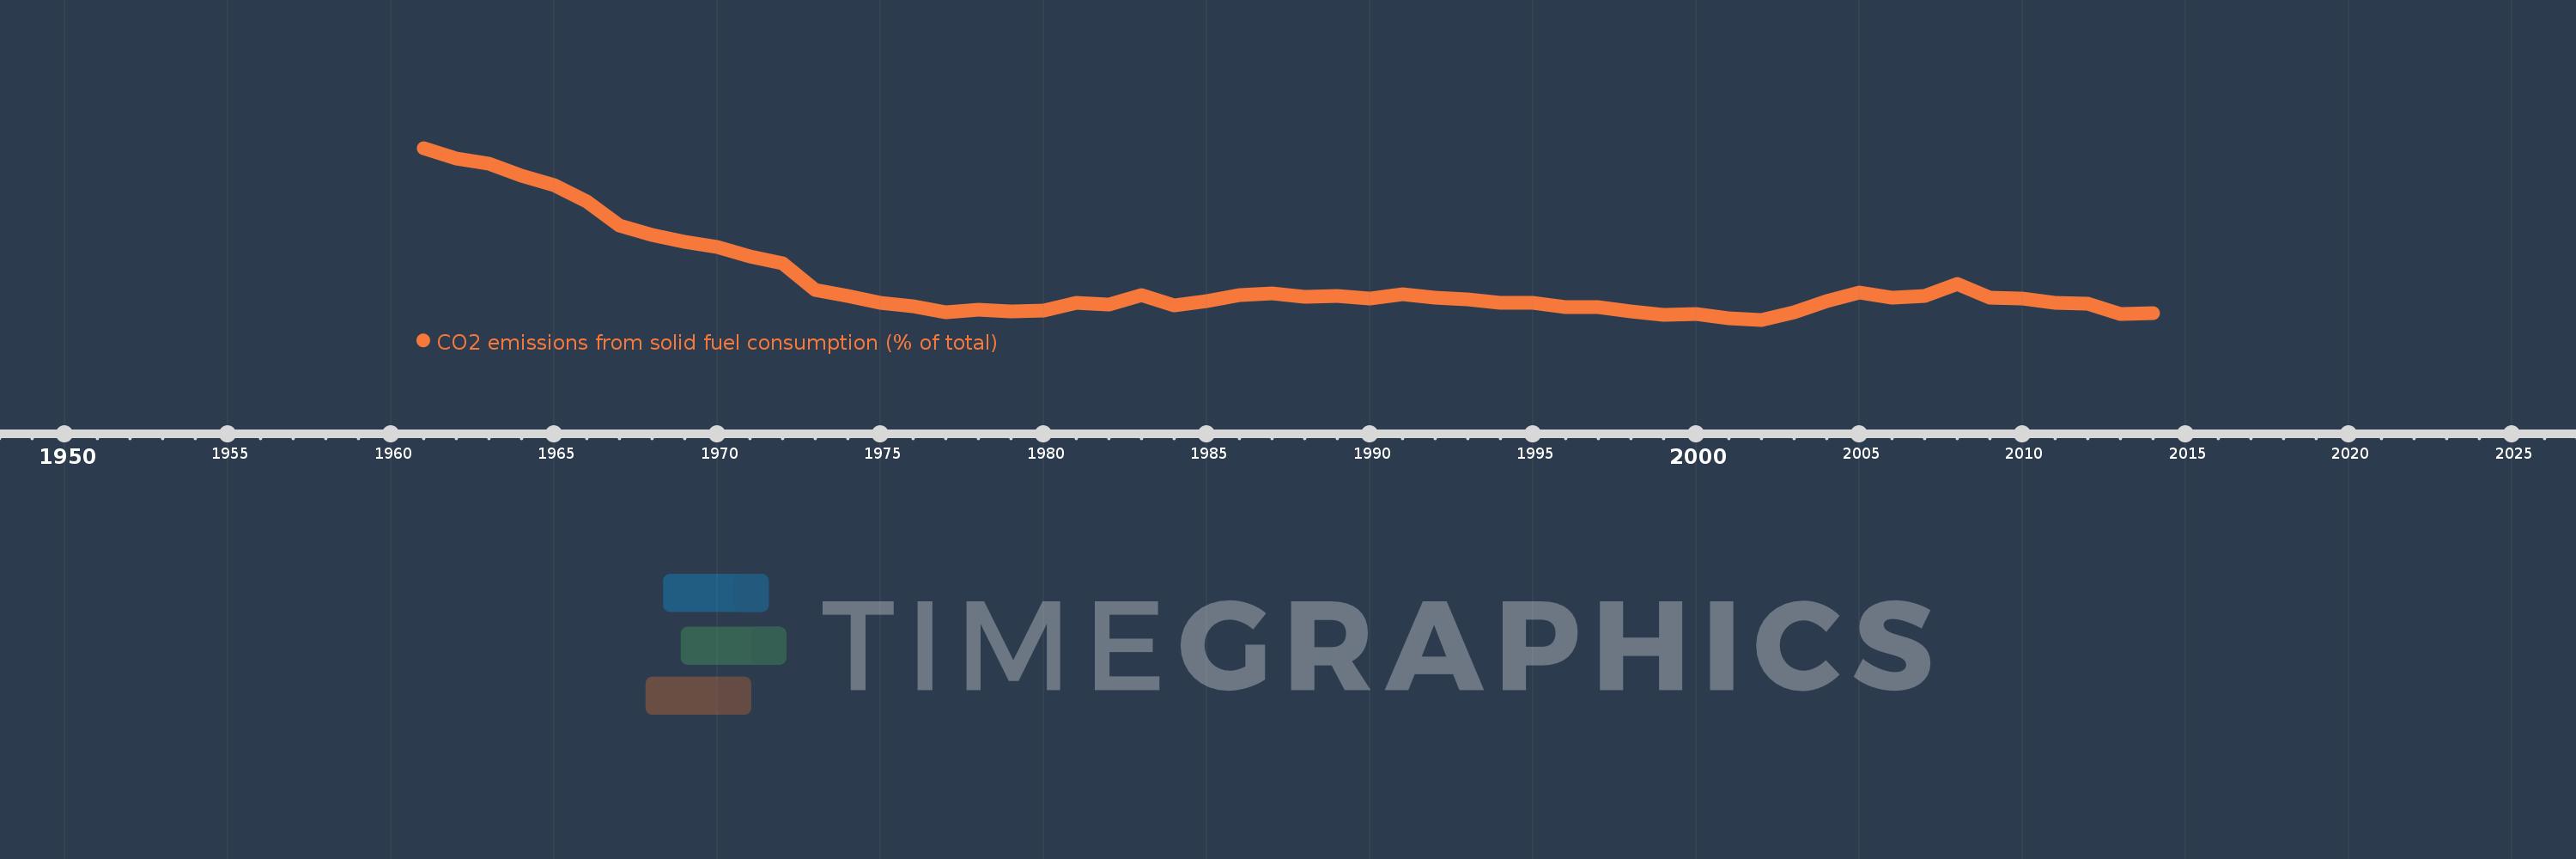
CO2 emissions from solid fuel consumption (% of total)
2014,2013,2012,2011,2010,2009,2008,2007,2006,2005,2004,2003,2002,2001,2000,1999,1998,1997,1996,1995,1994,1993,1992,1991,1990,1989,1988,1987,1986,1985,1984,1983,1982,1981,1980,1979,1978,1977,1976,1975,1974,1973,1972,1971,1970,1969,1968,1967,1966,1965,1964,1963,1962,1961
This statistics in other country:
AfghanistanAlbaniaAlgeriaAndorraAngolaAntigua and BarbudaArab WorldArgentinaArmeniaArubaAustraliaAustriaAzerbaijanBahamas, TheBahrainBangladeshBarbadosBelarusBelgiumBelizeBeninBermudaBhutanBoliviaBosnia and HerzegovinaBotswanaBrazilBritish Virgin IslandsBrunei DarussalamBulgariaBurkina FasoBurundiCabo VerdeCambodiaCameroonCanadaCaribbean small statesCayman IslandsCentral African RepublicCentral Europe and the BalticsChadChileChinaColombiaComorosCongo, Dem. Rep.Congo, Rep.Costa RicaCote d'IvoireCroatiaCubaCuracaoCyprusCzech RepublicDenmarkDjiboutiDominicaDominican RepublicEarly-demographic dividendEast Asia & PacificEast Asia & Pacific (excluding high income)East Asia & Pacific (IDA & IBRD countries)EcuadorEgypt, Arab Rep.El SalvadorEquatorial GuineaEritreaEstoniaEthiopiaEuro areaEurope & Central AsiaEurope & Central Asia (excluding high income)Europe & Central Asia (IDA & IBRD countries)European UnionFaroe IslandsFijiFinlandFragile and conflict affected situationsFranceFrench PolynesiaGabonGambia, TheGeorgiaGermanyGhanaGibraltarGreeceGreenlandGrenadaGuatemalaGuineaGuinea-BissauGuyanaHaitiHeavily indebted poor countries (HIPC)High incomeHondurasHong Kong SAR, ChinaHungaryIBRD onlyIcelandIDA & IBRD totalIDA blendIDA onlyIDA totalIndiaIndonesiaIran, Islamic Rep.IraqIrelandIsraelItalyJamaicaJapanJordanKazakhstanKenyaKiribatiKorea, Dem. People’s Rep.Korea, Rep.KuwaitKyrgyz RepublicLao PDRLate-demographic dividendLatin America & Caribbean Latin America & Caribbean (excluding high income)Latin America & the Caribbean (IDA & IBRD countries)LatviaLeast developed countries: UN classificationLebanonLesothoLiberiaLibyaLiechtensteinLithuaniaLow & middle incomeLow incomeLower middle incomeLuxembourgMacao SAR, ChinaMacedonia, FYRMadagascarMalawiMalaysiaMaldivesMaliMaltaMarshall IslandsMauritaniaMauritiusMexicoMicronesia, Fed. Sts.Middle East & North AfricaMiddle East & North Africa (excluding high income)Middle East & North Africa (IDA & IBRD countries)Middle incomeMoldovaMongoliaMontenegroMoroccoMozambiqueMyanmarNamibiaNauruNepalNetherlandsNew CaledoniaNew ZealandNicaraguaNigerNigeriaNorth AmericaNorwayOECD membersOmanOther small statesPacific island small statesPakistanPalauPanamaPapua New GuineaParaguayPeruPhilippinesPolandPortugalPost-demographic dividendPre-demographic dividendQatarRomaniaRussian FederationRwandaSamoaSao Tome and PrincipeSaudi ArabiaSenegalSerbiaSeychellesSierra LeoneSingaporeSint Maarten (Dutch part)Slovak RepublicSloveniaSmall statesSolomon IslandsSomaliaSouth AfricaSouth AsiaSouth Asia (IDA & IBRD)South SudanSpainSri LankaSt. Kitts and NevisSt. LuciaSt. Vincent and the GrenadinesSub-Saharan Africa Sub-Saharan Africa (excluding high income)Sub-Saharan Africa (IDA & IBRD countries)SudanSurinameSwazilandSwedenSwitzerlandSyrian Arab RepublicTajikistanTanzaniaThailandTimor-LesteTogoTongaTrinidad and TobagoTunisiaTurkeyTurkmenistanTurks and Caicos IslandsUgandaUkraineUnited Arab EmiratesUnited KingdomUnited StatesUpper middle incomeUruguayUzbekistanVanuatuVenezuela, RBVietnamWest Bank and GazaWorldYemen, Rep.ZambiaZimbabwe Timeline:
This timeline shows a graph from 1961 to 2014 of Pakistan. No data until 1960. Number of actual observations by date: 54.
Source name:
World Development Indicators
Source organization:
Carbon Dioxide Information Analysis Center, Environmental Sciences Division, Oak Ridge National Laboratory, Tennessee, United States.
Categories, topics:
Climate Change, Environment
Last updated:
apr 23, 2017
Indicators value changes by year
Maximum:
41.632
jan 1, 1961
At the date of observation
Value
Absolute change
Change from previous value
jan 1, 1961
41.632
+41.632
0.0%
jan 1, 1962
39.605
-2.027
-4.87%
jan 1, 1963
38.434
-1.171
-2.96%
jan 1, 1964
36.086
-2.347
-6.11%
jan 1, 1965
34.271
-1.816
-5.03%
jan 1, 1966
30.898
-3.373
-9.84%
jan 1, 1967
26.231
-4.666
-15.1%
jan 1, 1968
24.273
-1.958
-7.46%
jan 1, 1969
22.962
-1.312
-5.4%
jan 1, 1970
21.84
-1.122
-4.88%
jan 1, 1971
20.054
-1.786
-8.18%
jan 1, 1972
18.687
-1.367
-6.82%
jan 1, 1973
13.289
-5.398
-28.89%
jan 1, 1974
12.152
-1.137
-8.56%
jan 1, 1975
10.717
-1.435
-11.81%
jan 1, 1976
10.202
-0.515
-4.81%
jan 1, 1977
8.847
-1.355
-13.28%
jan 1, 1978
9.472
+0.625
7.07%
jan 1, 1979
9.021
-0.451
-4.77%
jan 1, 1980
9.294
+0.273
3.03%
jan 1, 1981
10.875
+1.581
17.01%
jan 1, 1982
10.521
-0.354
-3.25%
jan 1, 1983
12.418
+1.897
18.03%
jan 1, 1984
10.318
-2.1
-16.91%
jan 1, 1985
11.226
+0.909
8.81%
jan 1, 1986
12.297
+1.071
9.54%
jan 1, 1987
12.687
+0.39
3.17%
jan 1, 1988
12.035
-0.652
-5.14%
jan 1, 1989
12.22
+0.185
1.54%
jan 1, 1990
11.628
-0.592
-4.84%
jan 1, 1991
12.451
+0.822
7.07%
jan 1, 1992
11.768
-0.683
-5.48%
jan 1, 1993
11.496
-0.272
-2.31%
jan 1, 1994
10.859
-0.637
-5.54%
jan 1, 1995
10.862
+0.003
0.03%
jan 1, 1996
9.87
-0.992
-9.13%
jan 1, 1997
9.916
+0.046
0.47%
jan 1, 1998
9.06
-0.856
-8.63%
jan 1, 1999
8.384
-0.676
-7.46%
jan 1, 2000
8.566
+0.182
2.17%
jan 1, 2001
7.699
-0.867
-10.12%
jan 1, 2002
7.433
-0.266
-3.45%
jan 1, 2003
8.843
+1.409
18.96%
jan 1, 2004
11.106
+2.264
25.6%
jan 1, 2005
12.857
+1.75
15.76%
jan 1, 2006
11.86
-0.997
-7.76%
jan 1, 2007
12.12
+0.26
2.2%
jan 1, 2008
14.555
+2.435
20.09%
jan 1, 2009
11.897
-2.658
-18.26%
jan 1, 2010
11.663
-0.234
-1.97%
jan 1, 2011
10.806
-0.857
-7.35%
jan 1, 2012
10.604
-0.202
-1.87%
jan 1, 2013
8.654
-1.951
-18.4%
jan 1, 2014
8.67
+0.016
0.19%
Ranking of countries by current statistics by years


Comments: