29
/
en
AIzaSyAYiBZKx7MnpbEhh9jyipgxe19OcubqV5w
April 1, 2024
163586
Japan
JPN
true
2
1
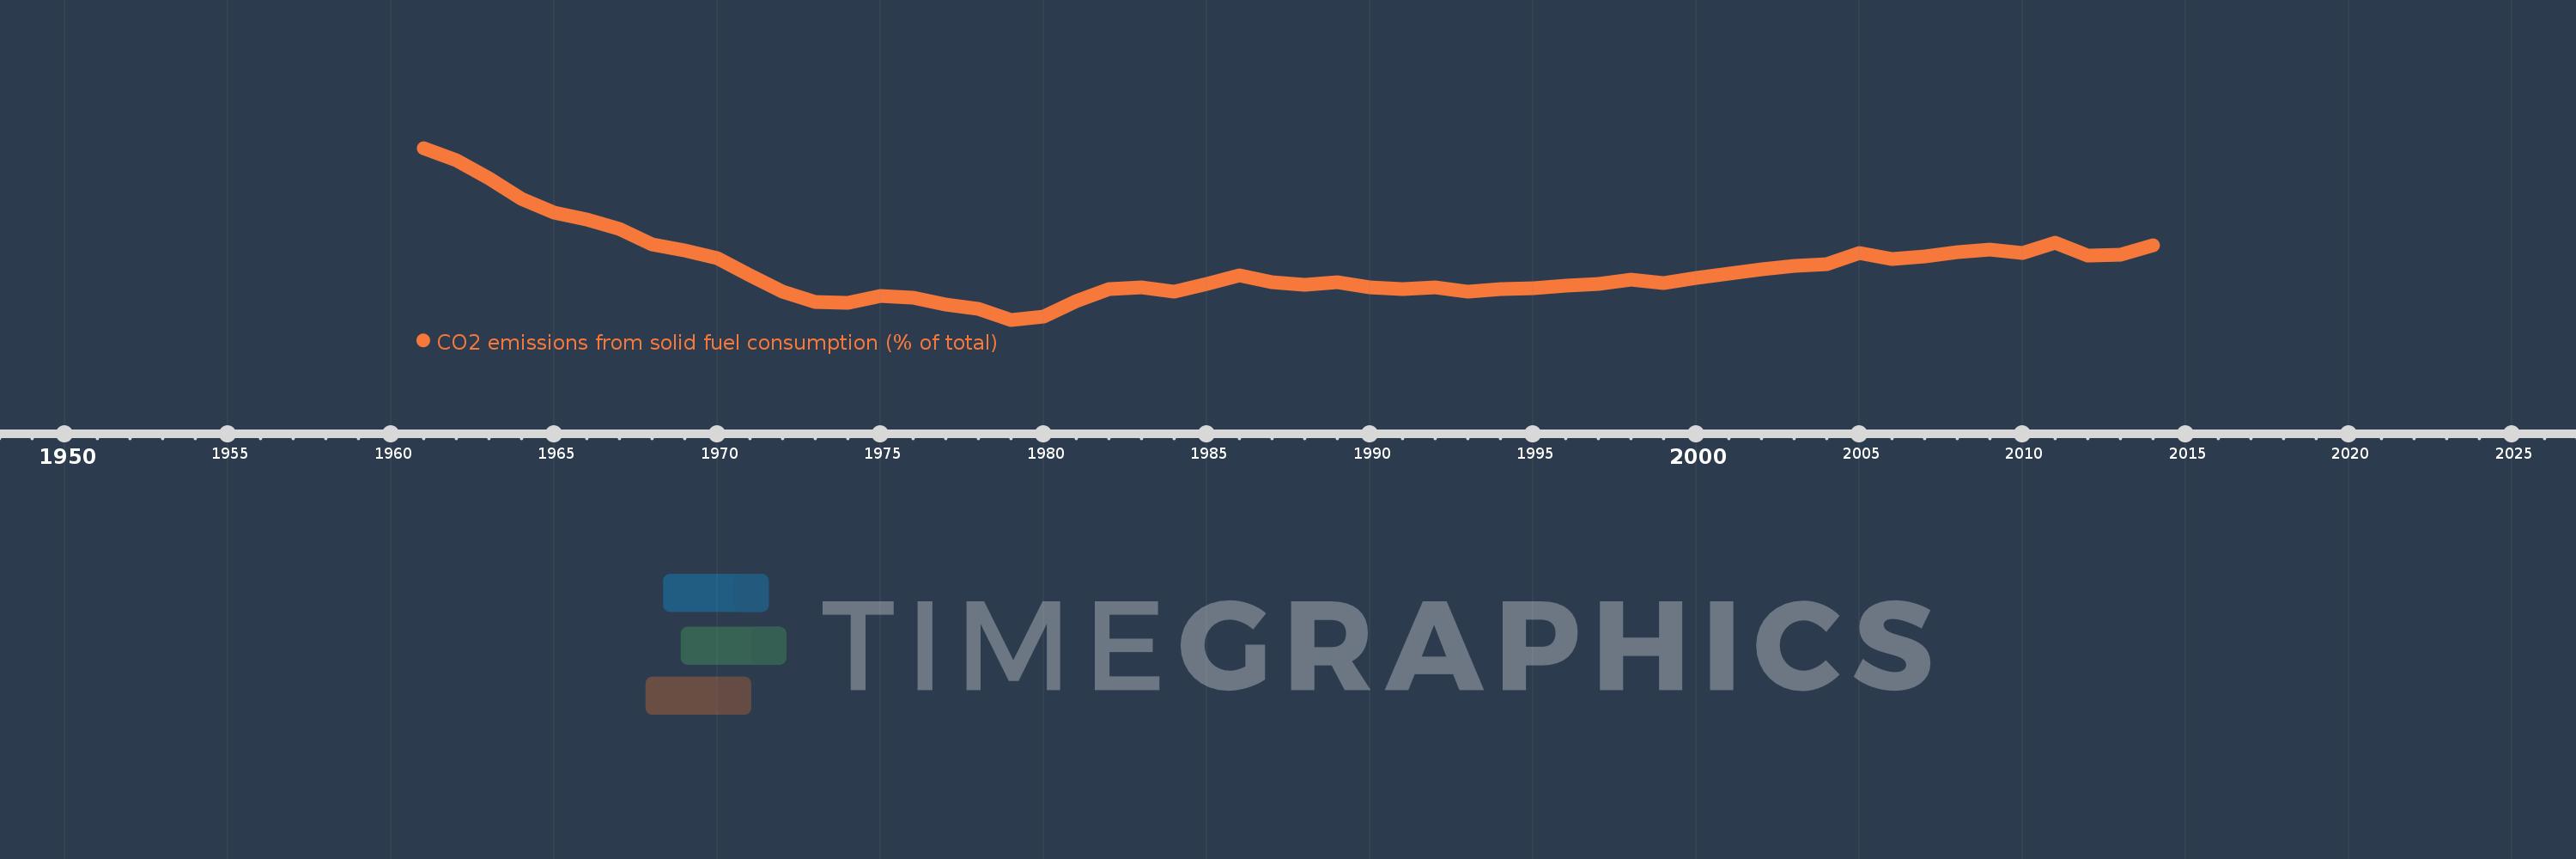
CO2 emissions from solid fuel consumption (% of total)
2014,2013,2012,2011,2010,2009,2008,2007,2006,2005,2004,2003,2002,2001,2000,1999,1998,1997,1996,1995,1994,1993,1992,1991,1990,1989,1988,1987,1986,1985,1984,1983,1982,1981,1980,1979,1978,1977,1976,1975,1974,1973,1972,1971,1970,1969,1968,1967,1966,1965,1964,1963,1962,1961
This statistics in other country:
AfghanistanAlbaniaAlgeriaAndorraAngolaAntigua and BarbudaArab WorldArgentinaArmeniaArubaAustraliaAustriaAzerbaijanBahamas, TheBahrainBangladeshBarbadosBelarusBelgiumBelizeBeninBermudaBhutanBoliviaBosnia and HerzegovinaBotswanaBrazilBritish Virgin IslandsBrunei DarussalamBulgariaBurkina FasoBurundiCabo VerdeCambodiaCameroonCanadaCaribbean small statesCayman IslandsCentral African RepublicCentral Europe and the BalticsChadChileChinaColombiaComorosCongo, Dem. Rep.Congo, Rep.Costa RicaCote d'IvoireCroatiaCubaCuracaoCyprusCzech RepublicDenmarkDjiboutiDominicaDominican RepublicEarly-demographic dividendEast Asia & PacificEast Asia & Pacific (excluding high income)East Asia & Pacific (IDA & IBRD countries)EcuadorEgypt, Arab Rep.El SalvadorEquatorial GuineaEritreaEstoniaEthiopiaEuro areaEurope & Central AsiaEurope & Central Asia (excluding high income)Europe & Central Asia (IDA & IBRD countries)European UnionFaroe IslandsFijiFinlandFragile and conflict affected situationsFranceFrench PolynesiaGabonGambia, TheGeorgiaGermanyGhanaGibraltarGreeceGreenlandGrenadaGuatemalaGuineaGuinea-BissauGuyanaHaitiHeavily indebted poor countries (HIPC)High incomeHondurasHong Kong SAR, ChinaHungaryIBRD onlyIcelandIDA & IBRD totalIDA blendIDA onlyIDA totalIndiaIndonesiaIran, Islamic Rep.IraqIrelandIsraelItalyJamaicaJapanJordanKazakhstanKenyaKiribatiKorea, Dem. People’s Rep.Korea, Rep.KuwaitKyrgyz RepublicLao PDRLate-demographic dividendLatin America & Caribbean Latin America & Caribbean (excluding high income)Latin America & the Caribbean (IDA & IBRD countries)LatviaLeast developed countries: UN classificationLebanonLesothoLiberiaLibyaLiechtensteinLithuaniaLow & middle incomeLow incomeLower middle incomeLuxembourgMacao SAR, ChinaMacedonia, FYRMadagascarMalawiMalaysiaMaldivesMaliMaltaMarshall IslandsMauritaniaMauritiusMexicoMicronesia, Fed. Sts.Middle East & North AfricaMiddle East & North Africa (excluding high income)Middle East & North Africa (IDA & IBRD countries)Middle incomeMoldovaMongoliaMontenegroMoroccoMozambiqueMyanmarNamibiaNauruNepalNetherlandsNew CaledoniaNew ZealandNicaraguaNigerNigeriaNorth AmericaNorwayOECD membersOmanOther small statesPacific island small statesPakistanPalauPanamaPapua New GuineaParaguayPeruPhilippinesPolandPortugalPost-demographic dividendPre-demographic dividendQatarRomaniaRussian FederationRwandaSamoaSao Tome and PrincipeSaudi ArabiaSenegalSerbiaSeychellesSierra LeoneSingaporeSint Maarten (Dutch part)Slovak RepublicSloveniaSmall statesSolomon IslandsSomaliaSouth AfricaSouth AsiaSouth Asia (IDA & IBRD)South SudanSpainSri LankaSt. Kitts and NevisSt. LuciaSt. Vincent and the GrenadinesSub-Saharan Africa Sub-Saharan Africa (excluding high income)Sub-Saharan Africa (IDA & IBRD countries)SudanSurinameSwazilandSwedenSwitzerlandSyrian Arab RepublicTajikistanTanzaniaThailandTimor-LesteTogoTongaTrinidad and TobagoTunisiaTurkeyTurkmenistanTurks and Caicos IslandsUgandaUkraineUnited Arab EmiratesUnited KingdomUnited StatesUpper middle incomeUruguayUzbekistanVanuatuVenezuela, RBVietnamWest Bank and GazaWorldYemen, Rep.ZambiaZimbabwe Timeline:
This timeline shows a graph from 1961 to 2014 of Japan. No data until 1960. Number of actual observations by date: 54.
Source name:
World Development Indicators
Source organization:
Carbon Dioxide Information Analysis Center, Environmental Sciences Division, Oak Ridge National Laboratory, Tennessee, United States.
Categories, topics:
Climate Change, Environment
Last updated:
apr 23, 2017
Indicators value changes by year
Minimum:
19.348
jan 1, 1979
Maximum:
59.824
jan 1, 1961
At the date of observation
Value
Absolute change
Change from previous value
jan 1, 1961
59.824
+59.824
0.0%
jan 1, 1962
56.865
-2.958
-4.94%
jan 1, 1963
52.636
-4.229
-7.44%
jan 1, 1964
47.803
-4.833
-9.18%
jan 1, 1965
44.623
-3.18
-6.65%
jan 1, 1966
42.873
-1.75
-3.92%
jan 1, 1967
40.641
-2.232
-5.21%
jan 1, 1968
37.08
-3.561
-8.76%
jan 1, 1969
35.602
-1.478
-3.99%
jan 1, 1970
33.825
-1.776
-4.99%
jan 1, 1971
29.845
-3.981
-11.77%
jan 1, 1972
25.899
-3.946
-13.22%
jan 1, 1973
23.481
-2.418
-9.34%
jan 1, 1974
23.43
-0.051
-0.22%
jan 1, 1975
25.045
+1.615
6.89%
jan 1, 1976
24.549
-0.496
-1.98%
jan 1, 1977
22.946
-1.604
-6.53%
jan 1, 1978
21.887
-1.059
-4.61%
jan 1, 1979
19.348
-2.539
-11.6%
jan 1, 1980
19.997
+0.649
3.35%
jan 1, 1981
23.69
+3.693
18.47%
jan 1, 1982
26.631
+2.94
12.41%
jan 1, 1983
26.975
+0.344
1.29%
jan 1, 1984
26.021
-0.954
-3.54%
jan 1, 1985
27.697
+1.676
6.44%
jan 1, 1986
29.715
+2.018
7.29%
jan 1, 1987
28.151
-1.564
-5.26%
jan 1, 1988
27.668
-0.483
-1.72%
jan 1, 1989
28.182
+0.514
1.86%
jan 1, 1990
27.042
-1.139
-4.04%
jan 1, 1991
26.628
-0.414
-1.53%
jan 1, 1992
27.016
+0.388
1.46%
jan 1, 1993
25.993
-1.023
-3.79%
jan 1, 1994
26.551
+0.558
2.15%
jan 1, 1995
26.694
+0.143
0.54%
jan 1, 1996
27.481
+0.787
2.95%
jan 1, 1997
27.782
+0.301
1.1%
jan 1, 1998
28.715
+0.933
3.36%
jan 1, 1999
28.011
-0.703
-2.45%
jan 1, 2000
29.178
+1.166
4.16%
jan 1, 2001
30.179
+1.002
3.43%
jan 1, 2002
31.283
+1.104
3.66%
jan 1, 2003
32.057
+0.774
2.47%
jan 1, 2004
32.515
+0.458
1.43%
jan 1, 2005
35.012
+2.497
7.68%
jan 1, 2006
33.721
-1.291
-3.69%
jan 1, 2007
34.292
+0.571
1.69%
jan 1, 2008
35.288
+0.995
2.9%
jan 1, 2009
35.818
+0.531
1.5%
jan 1, 2010
34.977
-0.842
-2.35%
jan 1, 2011
37.45
+2.473
7.07%
jan 1, 2012
34.437
-3.013
-8.05%
jan 1, 2013
34.601
+0.164
0.48%
jan 1, 2014
36.968
+2.367
6.84%
Ranking of countries by current statistics by years


Comments: