29
/
en
AIzaSyAYiBZKx7MnpbEhh9jyipgxe19OcubqV5w
April 1, 2024
31387
Europe & Central Asia (excluding high income)
ECA
false
2
1
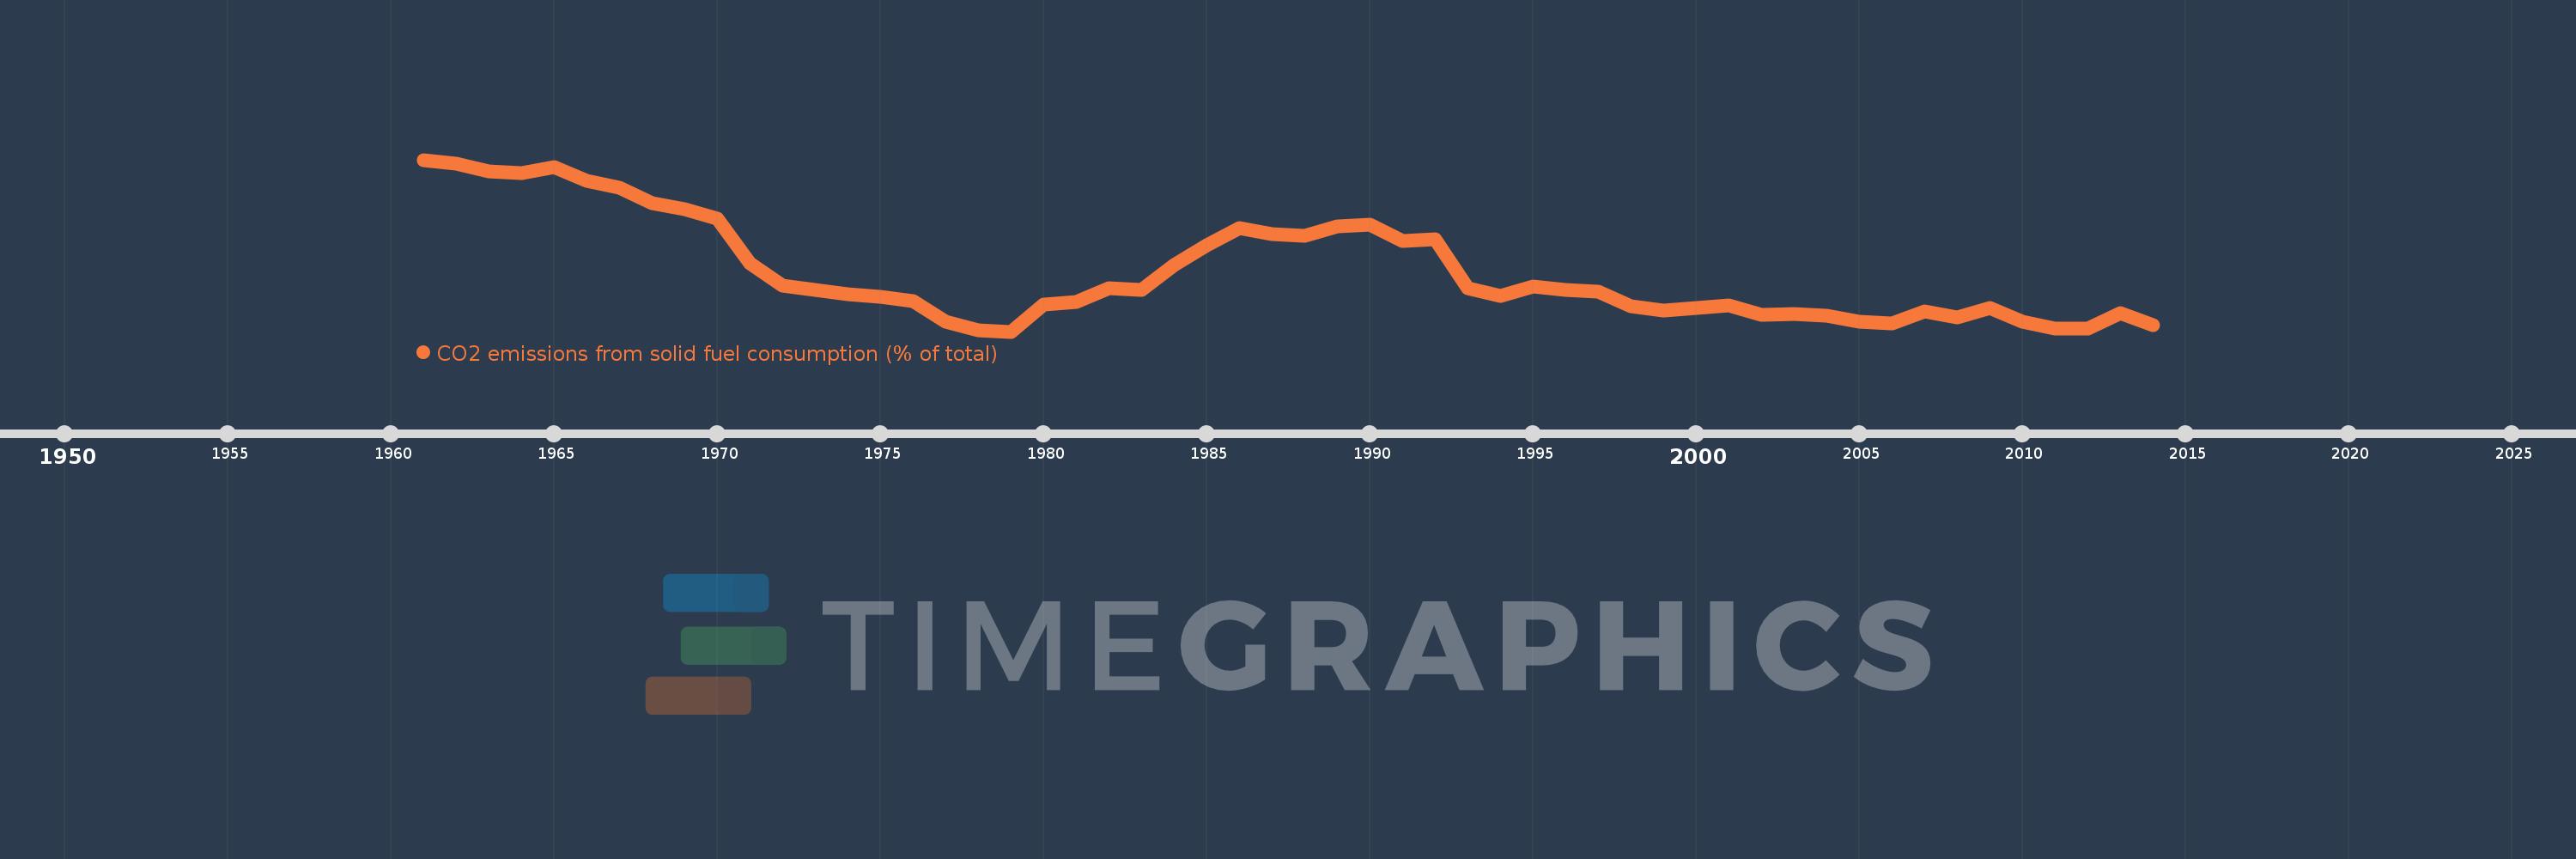
CO2 emissions from solid fuel consumption (% of total)
2014,2013,2012,2011,2010,2009,2008,2007,2006,2005,2004,2003,2002,2001,2000,1999,1998,1997,1996,1995,1994,1993,1992,1991,1990,1989,1988,1987,1986,1985,1984,1983,1982,1981,1980,1979,1978,1977,1976,1975,1974,1973,1972,1971,1970,1969,1968,1967,1966,1965,1964,1963,1962,1961
This statistics in other country:
AfghanistanAlbaniaAlgeriaAndorraAngolaAntigua and BarbudaArab WorldArgentinaArmeniaArubaAustraliaAustriaAzerbaijanBahamas, TheBahrainBangladeshBarbadosBelarusBelgiumBelizeBeninBermudaBhutanBoliviaBosnia and HerzegovinaBotswanaBrazilBritish Virgin IslandsBrunei DarussalamBulgariaBurkina FasoBurundiCabo VerdeCambodiaCameroonCanadaCaribbean small statesCayman IslandsCentral African RepublicCentral Europe and the BalticsChadChileChinaColombiaComorosCongo, Dem. Rep.Congo, Rep.Costa RicaCote d'IvoireCroatiaCubaCuracaoCyprusCzech RepublicDenmarkDjiboutiDominicaDominican RepublicEarly-demographic dividendEast Asia & PacificEast Asia & Pacific (excluding high income)East Asia & Pacific (IDA & IBRD countries)EcuadorEgypt, Arab Rep.El SalvadorEquatorial GuineaEritreaEstoniaEthiopiaEuro areaEurope & Central AsiaEurope & Central Asia (excluding high income)Europe & Central Asia (IDA & IBRD countries)European UnionFaroe IslandsFijiFinlandFragile and conflict affected situationsFranceFrench PolynesiaGabonGambia, TheGeorgiaGermanyGhanaGibraltarGreeceGreenlandGrenadaGuatemalaGuineaGuinea-BissauGuyanaHaitiHeavily indebted poor countries (HIPC)High incomeHondurasHong Kong SAR, ChinaHungaryIBRD onlyIcelandIDA & IBRD totalIDA blendIDA onlyIDA totalIndiaIndonesiaIran, Islamic Rep.IraqIrelandIsraelItalyJamaicaJapanJordanKazakhstanKenyaKiribatiKorea, Dem. People’s Rep.Korea, Rep.KuwaitKyrgyz RepublicLao PDRLate-demographic dividendLatin America & Caribbean Latin America & Caribbean (excluding high income)Latin America & the Caribbean (IDA & IBRD countries)LatviaLeast developed countries: UN classificationLebanonLesothoLiberiaLibyaLiechtensteinLithuaniaLow & middle incomeLow incomeLower middle incomeLuxembourgMacao SAR, ChinaMacedonia, FYRMadagascarMalawiMalaysiaMaldivesMaliMaltaMarshall IslandsMauritaniaMauritiusMexicoMicronesia, Fed. Sts.Middle East & North AfricaMiddle East & North Africa (excluding high income)Middle East & North Africa (IDA & IBRD countries)Middle incomeMoldovaMongoliaMontenegroMoroccoMozambiqueMyanmarNamibiaNauruNepalNetherlandsNew CaledoniaNew ZealandNicaraguaNigerNigeriaNorth AmericaNorwayOECD membersOmanOther small statesPacific island small statesPakistanPalauPanamaPapua New GuineaParaguayPeruPhilippinesPolandPortugalPost-demographic dividendPre-demographic dividendQatarRomaniaRussian FederationRwandaSamoaSao Tome and PrincipeSaudi ArabiaSenegalSerbiaSeychellesSierra LeoneSingaporeSint Maarten (Dutch part)Slovak RepublicSloveniaSmall statesSolomon IslandsSomaliaSouth AfricaSouth AsiaSouth Asia (IDA & IBRD)South SudanSpainSri LankaSt. Kitts and NevisSt. LuciaSt. Vincent and the GrenadinesSub-Saharan Africa Sub-Saharan Africa (excluding high income)Sub-Saharan Africa (IDA & IBRD countries)SudanSurinameSwazilandSwedenSwitzerlandSyrian Arab RepublicTajikistanTanzaniaThailandTimor-LesteTogoTongaTrinidad and TobagoTunisiaTurkeyTurkmenistanTurks and Caicos IslandsUgandaUkraineUnited Arab EmiratesUnited KingdomUnited StatesUpper middle incomeUruguayUzbekistanVanuatuVenezuela, RBVietnamWest Bank and GazaWorldYemen, Rep.ZambiaZimbabwe Timeline:
This timeline shows a graph from 1961 to 2014 of Europe & Central Asia (excluding high income). No data until 1960. Number of actual observations by date: 54.
Source name:
World Development Indicators
Source organization:
Carbon Dioxide Information Analysis Center, Environmental Sciences Division, Oak Ridge National Laboratory, Tennessee, United States.
Categories, topics:
Climate Change, Environment
Last updated:
apr 23, 2017
Indicators value changes by year
Minimum:
29.721
jan 1, 1979
Maximum:
48.102
jan 1, 1961
At the date of observation
Value
Absolute change
Change from previous value
jan 1, 1961
48.102
+48.102
0.0%
jan 1, 1962
47.707
-0.395
-0.82%
jan 1, 1963
46.879
-0.828
-1.74%
jan 1, 1964
46.642
-0.237
-0.5%
jan 1, 1965
47.318
+0.676
1.45%
jan 1, 1966
45.817
-1.5
-3.17%
jan 1, 1967
45.143
-0.674
-1.47%
jan 1, 1968
43.47
-1.673
-3.71%
jan 1, 1969
42.784
-0.686
-1.58%
jan 1, 1970
41.797
-0.987
-2.31%
jan 1, 1971
37.009
-4.788
-11.46%
jan 1, 1972
34.631
-2.378
-6.42%
jan 1, 1973
34.207
-0.424
-1.22%
jan 1, 1974
33.731
-0.476
-1.39%
jan 1, 1975
33.414
-0.318
-0.94%
jan 1, 1976
32.961
-0.453
-1.35%
jan 1, 1977
30.785
-2.176
-6.6%
jan 1, 1978
29.872
-0.914
-2.97%
jan 1, 1979
29.721
-0.151
-0.5%
jan 1, 1980
32.583
+2.863
9.63%
jan 1, 1981
32.866
+0.283
0.87%
jan 1, 1982
34.401
+1.534
4.67%
jan 1, 1983
34.14
-0.261
-0.76%
jan 1, 1984
36.805
+2.665
7.81%
jan 1, 1985
38.983
+2.179
5.92%
jan 1, 1986
40.794
+1.811
4.65%
jan 1, 1987
40.172
-0.622
-1.53%
jan 1, 1988
39.999
-0.173
-0.43%
jan 1, 1989
40.972
+0.973
2.43%
jan 1, 1990
41.204
+0.232
0.57%
jan 1, 1991
39.417
-1.787
-4.34%
jan 1, 1992
39.593
+0.176
0.45%
jan 1, 1993
34.36
-5.232
-13.22%
jan 1, 1994
33.575
-0.785
-2.29%
jan 1, 1995
34.563
+0.988
2.94%
jan 1, 1996
34.152
-0.412
-1.19%
jan 1, 1997
33.996
-0.155
-0.45%
jan 1, 1998
32.427
-1.569
-4.61%
jan 1, 1999
31.979
-0.448
-1.38%
jan 1, 2000
32.291
+0.312
0.98%
jan 1, 2001
32.494
+0.203
0.63%
jan 1, 2002
31.504
-0.99
-3.05%
jan 1, 2003
31.563
+0.058
0.18%
jan 1, 2004
31.405
-0.158
-0.5%
jan 1, 2005
30.808
-0.596
-1.9%
jan 1, 2006
30.58
-0.229
-0.74%
jan 1, 2007
31.863
+1.283
4.2%
jan 1, 2008
31.279
-0.584
-1.83%
jan 1, 2009
32.279
+1.0
3.2%
jan 1, 2010
30.766
-1.513
-4.69%
jan 1, 2011
30.061
-0.705
-2.29%
jan 1, 2012
30.084
+0.023
0.08%
jan 1, 2013
31.695
+1.611
5.35%
jan 1, 2014
30.392
-1.303
-4.11%
Ranking of countries by current statistics by years


Comments: