29
/
en
AIzaSyAYiBZKx7MnpbEhh9jyipgxe19OcubqV5w
April 1, 2024
133917
France
FRA
true
2
1
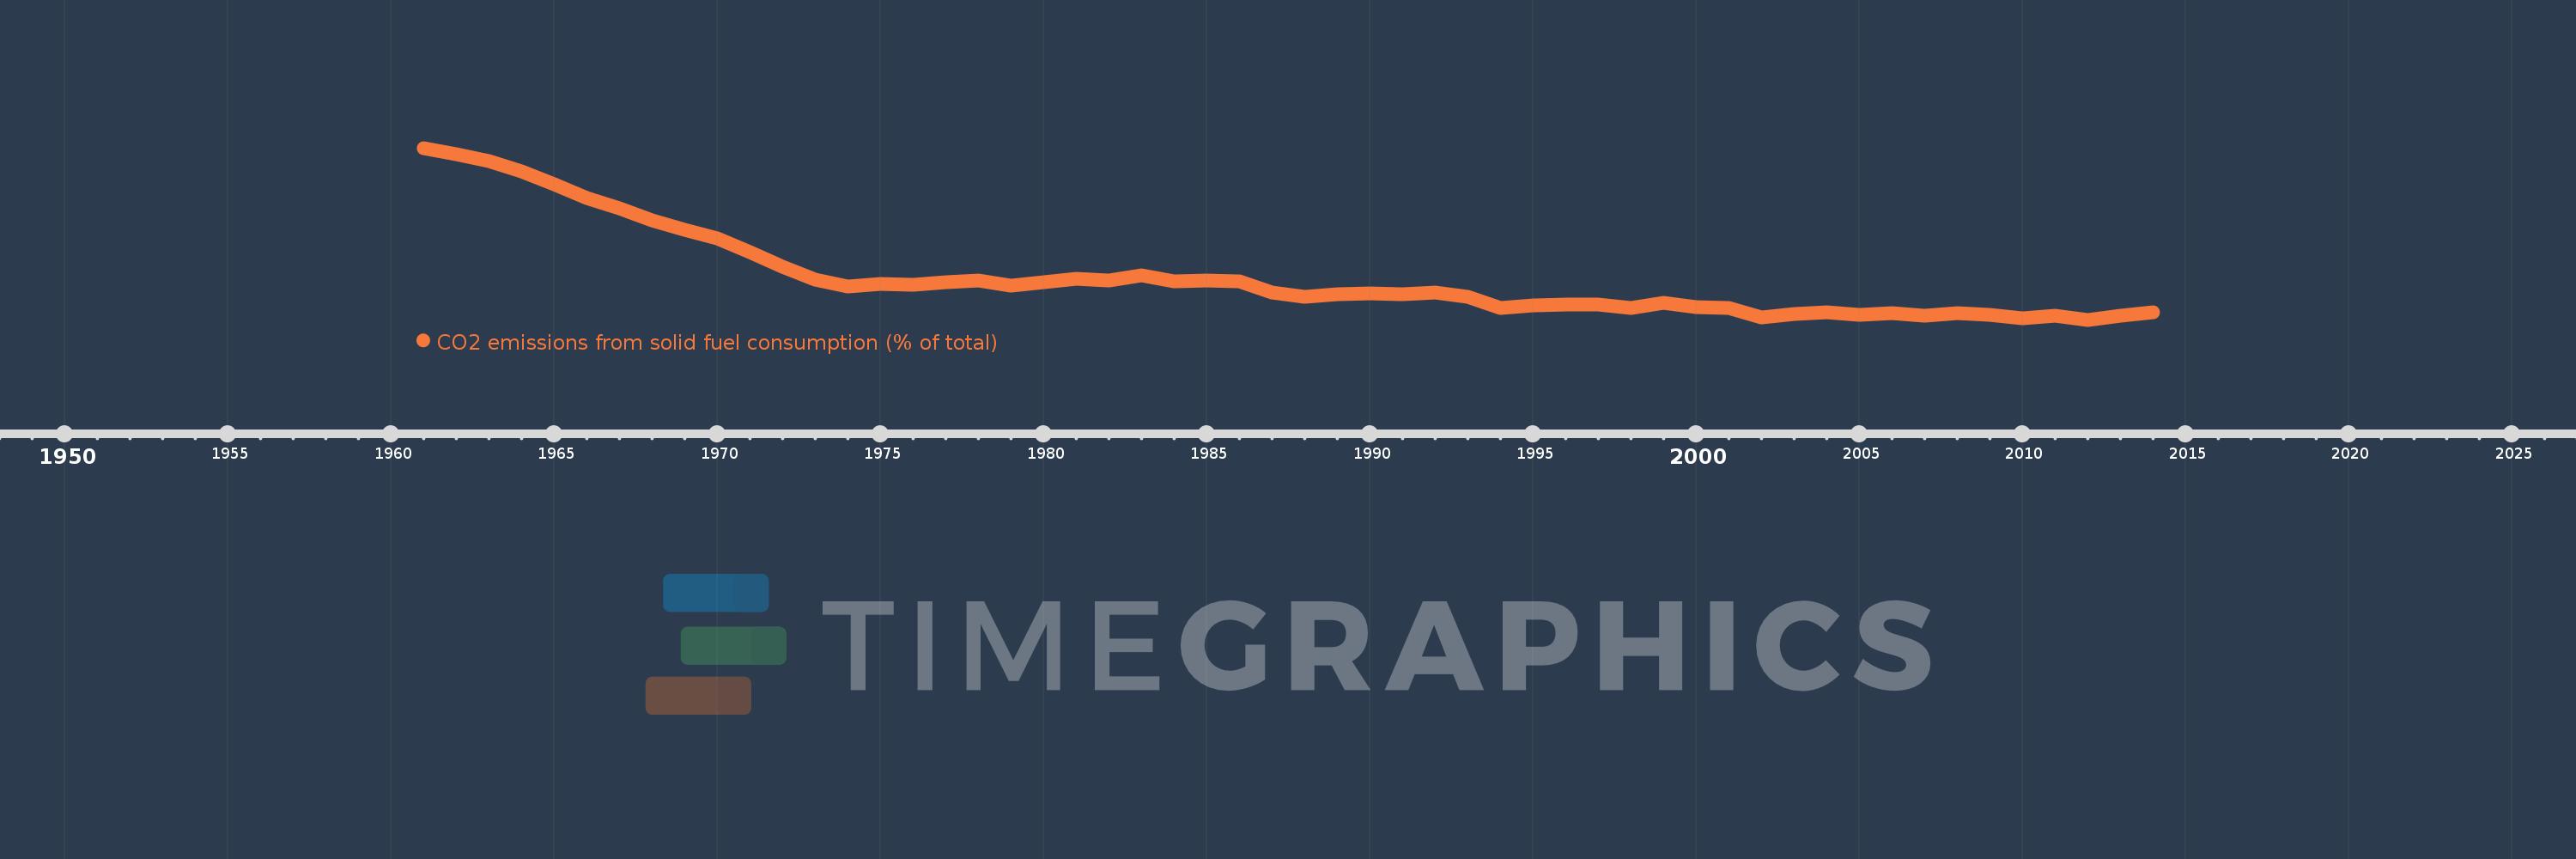
CO2 emissions from solid fuel consumption (% of total)
2014,2013,2012,2011,2010,2009,2008,2007,2006,2005,2004,2003,2002,2001,2000,1999,1998,1997,1996,1995,1994,1993,1992,1991,1990,1989,1988,1987,1986,1985,1984,1983,1982,1981,1980,1979,1978,1977,1976,1975,1974,1973,1972,1971,1970,1969,1968,1967,1966,1965,1964,1963,1962,1961
This statistics in other country:
AfghanistanAlbaniaAlgeriaAndorraAngolaAntigua and BarbudaArab WorldArgentinaArmeniaArubaAustraliaAustriaAzerbaijanBahamas, TheBahrainBangladeshBarbadosBelarusBelgiumBelizeBeninBermudaBhutanBoliviaBosnia and HerzegovinaBotswanaBrazilBritish Virgin IslandsBrunei DarussalamBulgariaBurkina FasoBurundiCabo VerdeCambodiaCameroonCanadaCaribbean small statesCayman IslandsCentral African RepublicCentral Europe and the BalticsChadChileChinaColombiaComorosCongo, Dem. Rep.Congo, Rep.Costa RicaCote d'IvoireCroatiaCubaCuracaoCyprusCzech RepublicDenmarkDjiboutiDominicaDominican RepublicEarly-demographic dividendEast Asia & PacificEast Asia & Pacific (excluding high income)East Asia & Pacific (IDA & IBRD countries)EcuadorEgypt, Arab Rep.El SalvadorEquatorial GuineaEritreaEstoniaEthiopiaEuro areaEurope & Central AsiaEurope & Central Asia (excluding high income)Europe & Central Asia (IDA & IBRD countries)European UnionFaroe IslandsFijiFinlandFragile and conflict affected situationsFranceFrench PolynesiaGabonGambia, TheGeorgiaGermanyGhanaGibraltarGreeceGreenlandGrenadaGuatemalaGuineaGuinea-BissauGuyanaHaitiHeavily indebted poor countries (HIPC)High incomeHondurasHong Kong SAR, ChinaHungaryIBRD onlyIcelandIDA & IBRD totalIDA blendIDA onlyIDA totalIndiaIndonesiaIran, Islamic Rep.IraqIrelandIsraelItalyJamaicaJapanJordanKazakhstanKenyaKiribatiKorea, Dem. People’s Rep.Korea, Rep.KuwaitKyrgyz RepublicLao PDRLate-demographic dividendLatin America & Caribbean Latin America & Caribbean (excluding high income)Latin America & the Caribbean (IDA & IBRD countries)LatviaLeast developed countries: UN classificationLebanonLesothoLiberiaLibyaLiechtensteinLithuaniaLow & middle incomeLow incomeLower middle incomeLuxembourgMacao SAR, ChinaMacedonia, FYRMadagascarMalawiMalaysiaMaldivesMaliMaltaMarshall IslandsMauritaniaMauritiusMexicoMicronesia, Fed. Sts.Middle East & North AfricaMiddle East & North Africa (excluding high income)Middle East & North Africa (IDA & IBRD countries)Middle incomeMoldovaMongoliaMontenegroMoroccoMozambiqueMyanmarNamibiaNauruNepalNetherlandsNew CaledoniaNew ZealandNicaraguaNigerNigeriaNorth AmericaNorwayOECD membersOmanOther small statesPacific island small statesPakistanPalauPanamaPapua New GuineaParaguayPeruPhilippinesPolandPortugalPost-demographic dividendPre-demographic dividendQatarRomaniaRussian FederationRwandaSamoaSao Tome and PrincipeSaudi ArabiaSenegalSerbiaSeychellesSierra LeoneSingaporeSint Maarten (Dutch part)Slovak RepublicSloveniaSmall statesSolomon IslandsSomaliaSouth AfricaSouth AsiaSouth Asia (IDA & IBRD)South SudanSpainSri LankaSt. Kitts and NevisSt. LuciaSt. Vincent and the GrenadinesSub-Saharan Africa Sub-Saharan Africa (excluding high income)Sub-Saharan Africa (IDA & IBRD countries)SudanSurinameSwazilandSwedenSwitzerlandSyrian Arab RepublicTajikistanTanzaniaThailandTimor-LesteTogoTongaTrinidad and TobagoTunisiaTurkeyTurkmenistanTurks and Caicos IslandsUgandaUkraineUnited Arab EmiratesUnited KingdomUnited StatesUpper middle incomeUruguayUzbekistanVanuatuVenezuela, RBVietnamWest Bank and GazaWorldYemen, Rep.ZambiaZimbabwe Timeline:
This timeline shows a graph from 1961 to 2014 of France. No data until 1960. Number of actual observations by date: 54.
Source name:
World Development Indicators
Source organization:
Carbon Dioxide Information Analysis Center, Environmental Sciences Division, Oak Ridge National Laboratory, Tennessee, United States.
Categories, topics:
Climate Change, Environment
Last updated:
apr 23, 2017
Indicators value changes by year
Minimum:
11.661
jan 1, 2012
Maximum:
66.732
jan 1, 1961
At the date of observation
Value
Absolute change
Change from previous value
jan 1, 1961
66.732
+66.732
0.0%
jan 1, 1962
64.676
-2.056
-3.08%
jan 1, 1963
62.422
-2.254
-3.48%
jan 1, 1964
59.181
-3.241
-5.19%
jan 1, 1965
55.148
-4.033
-6.82%
jan 1, 1966
50.668
-4.48
-8.12%
jan 1, 1967
47.403
-3.264
-6.44%
jan 1, 1968
43.56
-3.843
-8.11%
jan 1, 1969
40.395
-3.166
-7.27%
jan 1, 1970
37.65
-2.745
-6.8%
jan 1, 1971
33.278
-4.372
-11.61%
jan 1, 1972
28.786
-4.492
-13.5%
jan 1, 1973
24.483
-4.303
-14.95%
jan 1, 1974
22.377
-2.106
-8.6%
jan 1, 1975
23.226
+0.849
3.79%
jan 1, 1976
22.748
-0.478
-2.06%
jan 1, 1977
23.685
+0.938
4.12%
jan 1, 1978
24.278
+0.593
2.5%
jan 1, 1979
22.629
-1.649
-6.79%
jan 1, 1980
23.625
+0.995
4.4%
jan 1, 1981
24.781
+1.156
4.89%
jan 1, 1982
24.244
-0.537
-2.17%
jan 1, 1983
25.961
+1.718
7.08%
jan 1, 1984
23.906
-2.056
-7.92%
jan 1, 1985
24.172
+0.266
1.11%
jan 1, 1986
23.844
-0.328
-1.36%
jan 1, 1987
20.277
-3.566
-14.96%
jan 1, 1988
19.108
-1.169
-5.77%
jan 1, 1989
19.76
+0.653
3.42%
jan 1, 1990
20.073
+0.313
1.58%
jan 1, 1991
19.955
-0.118
-0.59%
jan 1, 1992
20.286
+0.331
1.66%
jan 1, 1993
19.048
-1.239
-6.11%
jan 1, 1994
15.491
-3.557
-18.67%
jan 1, 1995
16.33
+0.839
5.42%
jan 1, 1996
16.475
+0.145
0.89%
jan 1, 1997
16.528
+0.053
0.32%
jan 1, 1998
15.483
-1.045
-6.32%
jan 1, 1999
17.032
+1.548
10.0%
jan 1, 2000
15.578
-1.454
-8.54%
jan 1, 2001
15.351
-0.227
-1.45%
jan 1, 2002
12.493
-2.858
-18.62%
jan 1, 2003
13.455
+0.963
7.71%
jan 1, 2004
14.008
+0.553
4.11%
jan 1, 2005
13.317
-0.691
-4.93%
jan 1, 2006
13.714
+0.397
2.98%
jan 1, 2007
13.049
-0.665
-4.85%
jan 1, 2008
13.764
+0.715
5.48%
jan 1, 2009
13.228
-0.536
-3.9%
jan 1, 2010
11.996
-1.232
-9.31%
jan 1, 2011
12.819
+0.823
6.86%
jan 1, 2012
11.661
-1.158
-9.03%
jan 1, 2013
12.825
+1.164
9.98%
jan 1, 2014
13.959
+1.133
8.84%
Ranking of countries by current statistics by years


Comments: