29
/
en
AIzaSyAYiBZKx7MnpbEhh9jyipgxe19OcubqV5w
April 1, 2024
62447
World
WLD
false
2
1
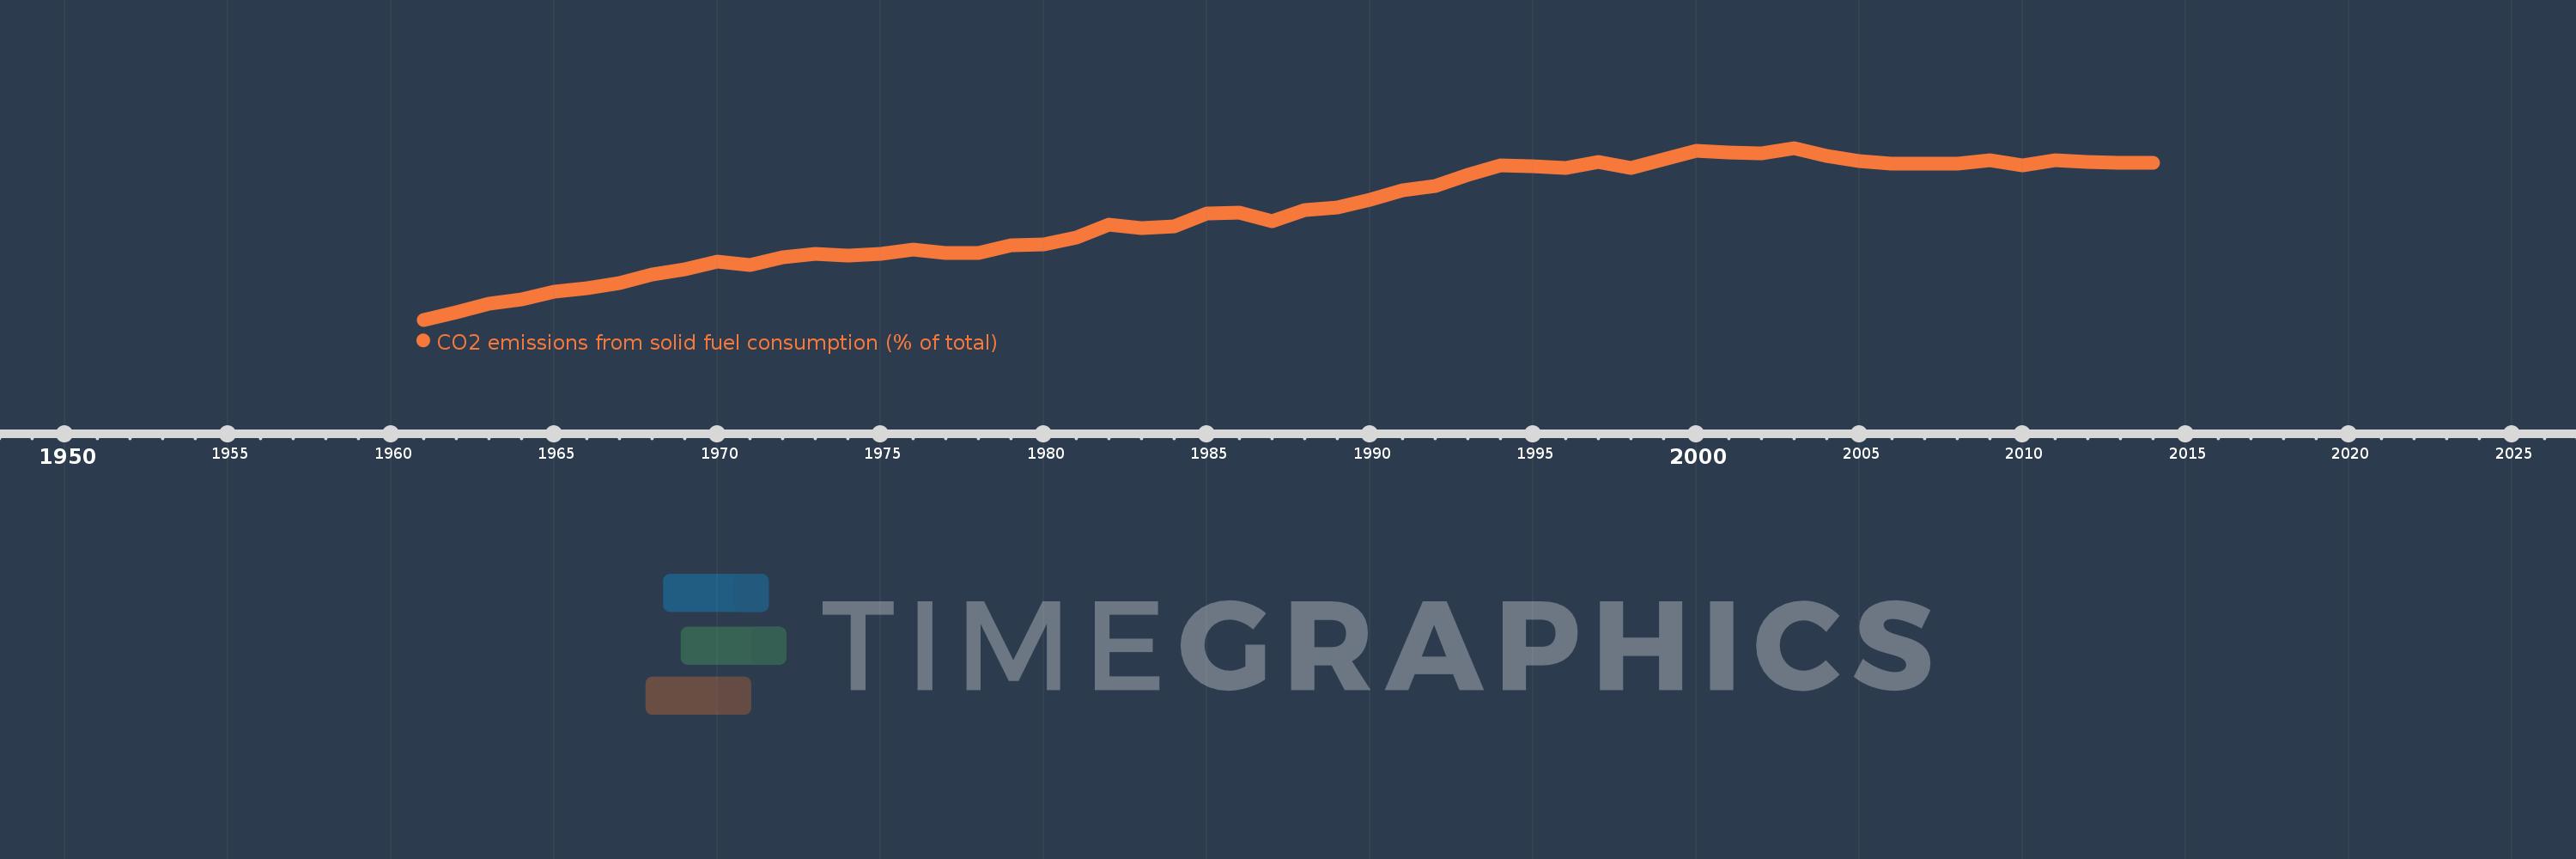
CO2 emissions from solid fuel consumption (% of total)
2014,2013,2012,2011,2010,2009,2008,2007,2006,2005,2004,2003,2002,2001,2000,1999,1998,1997,1996,1995,1994,1993,1992,1991,1990,1989,1988,1987,1986,1985,1984,1983,1982,1981,1980,1979,1978,1977,1976,1975,1974,1973,1972,1971,1970,1969,1968,1967,1966,1965,1964,1963,1962,1961
This statistics in other country:
AfghanistanAlbaniaAlgeriaAndorraAngolaAntigua and BarbudaArab WorldArgentinaArmeniaArubaAustraliaAustriaAzerbaijanBahamas, TheBahrainBangladeshBarbadosBelarusBelgiumBelizeBeninBermudaBhutanBoliviaBosnia and HerzegovinaBotswanaBrazilBritish Virgin IslandsBrunei DarussalamBulgariaBurkina FasoBurundiCabo VerdeCambodiaCameroonCanadaCaribbean small statesCayman IslandsCentral African RepublicCentral Europe and the BalticsChadChileChinaColombiaComorosCongo, Dem. Rep.Congo, Rep.Costa RicaCote d'IvoireCroatiaCubaCuracaoCyprusCzech RepublicDenmarkDjiboutiDominicaDominican RepublicEarly-demographic dividendEast Asia & PacificEast Asia & Pacific (excluding high income)East Asia & Pacific (IDA & IBRD countries)EcuadorEgypt, Arab Rep.El SalvadorEquatorial GuineaEritreaEstoniaEthiopiaEuro areaEurope & Central AsiaEurope & Central Asia (excluding high income)Europe & Central Asia (IDA & IBRD countries)European UnionFaroe IslandsFijiFinlandFragile and conflict affected situationsFranceFrench PolynesiaGabonGambia, TheGeorgiaGermanyGhanaGibraltarGreeceGreenlandGrenadaGuatemalaGuineaGuinea-BissauGuyanaHaitiHeavily indebted poor countries (HIPC)High incomeHondurasHong Kong SAR, ChinaHungaryIBRD onlyIcelandIDA & IBRD totalIDA blendIDA onlyIDA totalIndiaIndonesiaIran, Islamic Rep.IraqIrelandIsraelItalyJamaicaJapanJordanKazakhstanKenyaKiribatiKorea, Dem. People’s Rep.Korea, Rep.KuwaitKyrgyz RepublicLao PDRLate-demographic dividendLatin America & Caribbean Latin America & Caribbean (excluding high income)Latin America & the Caribbean (IDA & IBRD countries)LatviaLeast developed countries: UN classificationLebanonLesothoLiberiaLibyaLiechtensteinLithuaniaLow & middle incomeLow incomeLower middle incomeLuxembourgMacao SAR, ChinaMacedonia, FYRMadagascarMalawiMalaysiaMaldivesMaliMaltaMarshall IslandsMauritaniaMauritiusMexicoMicronesia, Fed. Sts.Middle East & North AfricaMiddle East & North Africa (excluding high income)Middle East & North Africa (IDA & IBRD countries)Middle incomeMoldovaMongoliaMontenegroMoroccoMozambiqueMyanmarNamibiaNauruNepalNetherlandsNew CaledoniaNew ZealandNicaraguaNigerNigeriaNorth AmericaNorwayOECD membersOmanOther small statesPacific island small statesPakistanPalauPanamaPapua New GuineaParaguayPeruPhilippinesPolandPortugalPost-demographic dividendPre-demographic dividendQatarRomaniaRussian FederationRwandaSamoaSao Tome and PrincipeSaudi ArabiaSenegalSerbiaSeychellesSierra LeoneSingaporeSint Maarten (Dutch part)Slovak RepublicSloveniaSmall statesSolomon IslandsSomaliaSouth AfricaSouth AsiaSouth Asia (IDA & IBRD)South SudanSpainSri LankaSt. Kitts and NevisSt. LuciaSt. Vincent and the GrenadinesSub-Saharan Africa Sub-Saharan Africa (excluding high income)Sub-Saharan Africa (IDA & IBRD countries)SudanSurinameSwazilandSwedenSwitzerlandSyrian Arab RepublicTajikistanTanzaniaThailandTimor-LesteTogoTongaTrinidad and TobagoTunisiaTurkeyTurkmenistanTurks and Caicos IslandsUgandaUkraineUnited Arab EmiratesUnited KingdomUnited StatesUpper middle incomeUruguayUzbekistanVanuatuVenezuela, RBVietnamWest Bank and GazaWorldYemen, Rep.ZambiaZimbabwe Timeline:
This timeline shows a graph from 1961 to 2014 of World. No data until 1960. Number of actual observations by date: 54.
Source name:
World Development Indicators
Source organization:
Carbon Dioxide Information Analysis Center, Environmental Sciences Division, Oak Ridge National Laboratory, Tennessee, United States.
Categories, topics:
Climate Change, Environment
Last updated:
apr 23, 2017
Indicators value changes by year
Maximum:
19.364
jan 1, 2003
At the date of observation
Value
Absolute change
Change from previous value
jan 1, 1961
8.869
+8.869
0.0%
jan 1, 1962
9.343
+0.474
5.35%
jan 1, 1963
9.832
+0.489
5.24%
jan 1, 1964
10.136
+0.303
3.09%
jan 1, 1965
10.592
+0.457
4.5%
jan 1, 1966
10.815
+0.222
2.1%
jan 1, 1967
11.129
+0.314
2.91%
jan 1, 1968
11.612
+0.483
4.34%
jan 1, 1969
11.949
+0.337
2.9%
jan 1, 1970
12.417
+0.467
3.91%
jan 1, 1971
12.224
-0.193
-1.55%
jan 1, 1972
12.661
+0.438
3.58%
jan 1, 1973
12.873
+0.212
1.67%
jan 1, 1974
12.808
-0.064
-0.5%
jan 1, 1975
12.914
+0.106
0.83%
jan 1, 1976
13.142
+0.228
1.77%
jan 1, 1977
12.953
-0.19
-1.44%
jan 1, 1978
12.959
+0.006
0.05%
jan 1, 1979
13.402
+0.443
3.42%
jan 1, 1980
13.459
+0.057
0.43%
jan 1, 1981
13.903
+0.444
3.3%
jan 1, 1982
14.695
+0.791
5.69%
jan 1, 1983
14.488
-0.207
-1.41%
jan 1, 1984
14.562
+0.074
0.51%
jan 1, 1985
15.349
+0.787
5.4%
jan 1, 1986
15.415
+0.067
0.43%
jan 1, 1987
14.867
-0.548
-3.55%
jan 1, 1988
15.581
+0.714
4.8%
jan 1, 1989
15.752
+0.171
1.09%
jan 1, 1990
16.189
+0.437
2.78%
jan 1, 1991
16.799
+0.609
3.76%
jan 1, 1992
17.016
+0.218
1.29%
jan 1, 1993
17.743
+0.727
4.27%
jan 1, 1994
18.301
+0.558
3.14%
jan 1, 1995
18.254
-0.047
-0.26%
jan 1, 1996
18.163
-0.091
-0.5%
jan 1, 1997
18.492
+0.329
1.81%
jan 1, 1998
18.141
-0.351
-1.9%
jan 1, 1999
18.643
+0.501
2.76%
jan 1, 2000
19.18
+0.537
2.88%
jan 1, 2001
19.102
-0.078
-0.4%
jan 1, 2002
19.053
-0.049
-0.26%
jan 1, 2003
19.364
+0.311
1.63%
jan 1, 2004
18.868
-0.496
-2.56%
jan 1, 2005
18.552
-0.316
-1.67%
jan 1, 2006
18.405
-0.147
-0.79%
jan 1, 2007
18.418
+0.013
0.07%
jan 1, 2008
18.391
-0.028
-0.15%
jan 1, 2009
18.608
+0.218
1.18%
jan 1, 2010
18.285
-0.323
-1.74%
jan 1, 2011
18.606
+0.321
1.75%
jan 1, 2012
18.532
-0.074
-0.4%
jan 1, 2013
18.478
-0.054
-0.29%
jan 1, 2014
18.474
-0.004
-0.02%
Ranking of countries by current statistics by years


Comments: