29
/
en
AIzaSyAYiBZKx7MnpbEhh9jyipgxe19OcubqV5w
April 1, 2024
141614
Greece
GRC
true
2
1
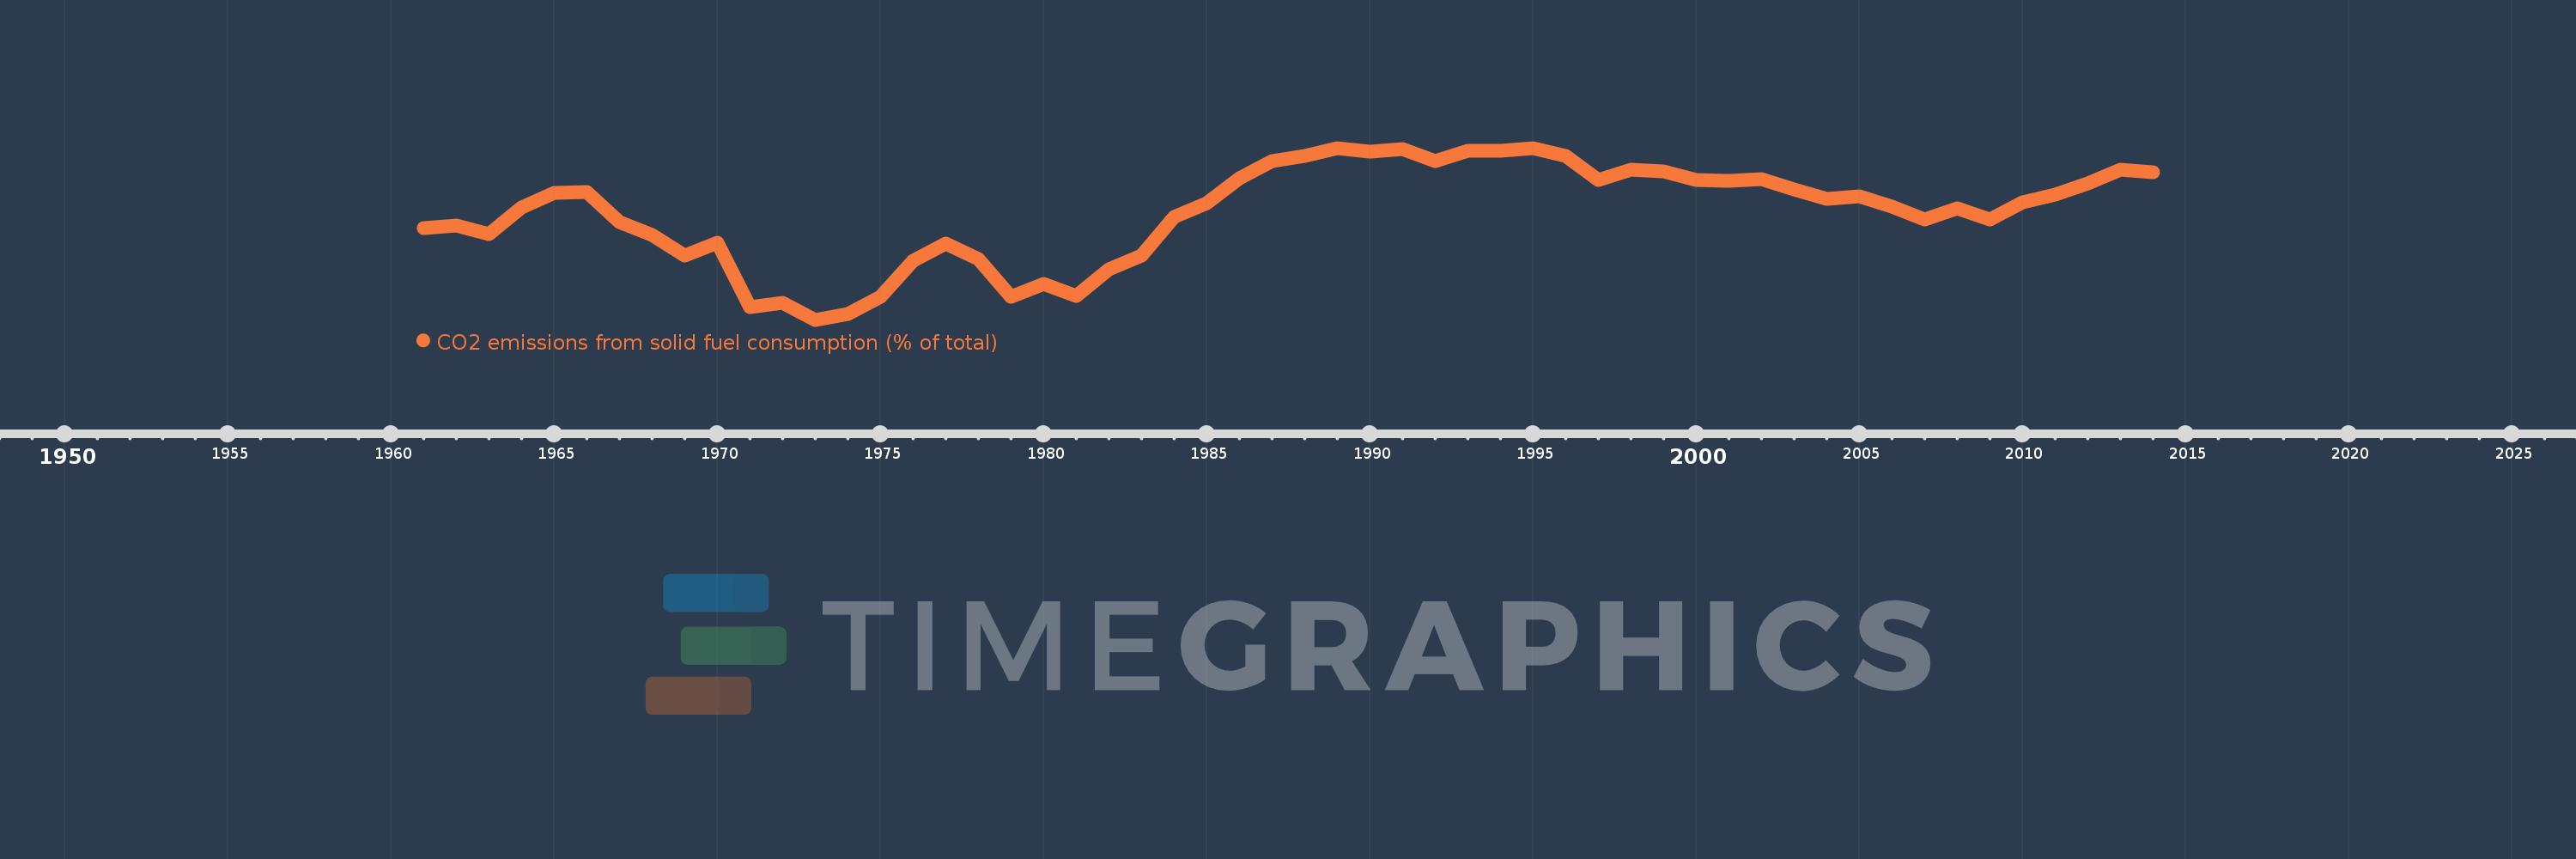
CO2 emissions from solid fuel consumption (% of total)
2014,2013,2012,2011,2010,2009,2008,2007,2006,2005,2004,2003,2002,2001,2000,1999,1998,1997,1996,1995,1994,1993,1992,1991,1990,1989,1988,1987,1986,1985,1984,1983,1982,1981,1980,1979,1978,1977,1976,1975,1974,1973,1972,1971,1970,1969,1968,1967,1966,1965,1964,1963,1962,1961
This statistics in other country:
AfghanistanAlbaniaAlgeriaAndorraAngolaAntigua and BarbudaArab WorldArgentinaArmeniaArubaAustraliaAustriaAzerbaijanBahamas, TheBahrainBangladeshBarbadosBelarusBelgiumBelizeBeninBermudaBhutanBoliviaBosnia and HerzegovinaBotswanaBrazilBritish Virgin IslandsBrunei DarussalamBulgariaBurkina FasoBurundiCabo VerdeCambodiaCameroonCanadaCaribbean small statesCayman IslandsCentral African RepublicCentral Europe and the BalticsChadChileChinaColombiaComorosCongo, Dem. Rep.Congo, Rep.Costa RicaCote d'IvoireCroatiaCubaCuracaoCyprusCzech RepublicDenmarkDjiboutiDominicaDominican RepublicEarly-demographic dividendEast Asia & PacificEast Asia & Pacific (excluding high income)East Asia & Pacific (IDA & IBRD countries)EcuadorEgypt, Arab Rep.El SalvadorEquatorial GuineaEritreaEstoniaEthiopiaEuro areaEurope & Central AsiaEurope & Central Asia (excluding high income)Europe & Central Asia (IDA & IBRD countries)European UnionFaroe IslandsFijiFinlandFragile and conflict affected situationsFranceFrench PolynesiaGabonGambia, TheGeorgiaGermanyGhanaGibraltarGreeceGreenlandGrenadaGuatemalaGuineaGuinea-BissauGuyanaHaitiHeavily indebted poor countries (HIPC)High incomeHondurasHong Kong SAR, ChinaHungaryIBRD onlyIcelandIDA & IBRD totalIDA blendIDA onlyIDA totalIndiaIndonesiaIran, Islamic Rep.IraqIrelandIsraelItalyJamaicaJapanJordanKazakhstanKenyaKiribatiKorea, Dem. People’s Rep.Korea, Rep.KuwaitKyrgyz RepublicLao PDRLate-demographic dividendLatin America & Caribbean Latin America & Caribbean (excluding high income)Latin America & the Caribbean (IDA & IBRD countries)LatviaLeast developed countries: UN classificationLebanonLesothoLiberiaLibyaLiechtensteinLithuaniaLow & middle incomeLow incomeLower middle incomeLuxembourgMacao SAR, ChinaMacedonia, FYRMadagascarMalawiMalaysiaMaldivesMaliMaltaMarshall IslandsMauritaniaMauritiusMexicoMicronesia, Fed. Sts.Middle East & North AfricaMiddle East & North Africa (excluding high income)Middle East & North Africa (IDA & IBRD countries)Middle incomeMoldovaMongoliaMontenegroMoroccoMozambiqueMyanmarNamibiaNauruNepalNetherlandsNew CaledoniaNew ZealandNicaraguaNigerNigeriaNorth AmericaNorwayOECD membersOmanOther small statesPacific island small statesPakistanPalauPanamaPapua New GuineaParaguayPeruPhilippinesPolandPortugalPost-demographic dividendPre-demographic dividendQatarRomaniaRussian FederationRwandaSamoaSao Tome and PrincipeSaudi ArabiaSenegalSerbiaSeychellesSierra LeoneSingaporeSint Maarten (Dutch part)Slovak RepublicSloveniaSmall statesSolomon IslandsSomaliaSouth AfricaSouth AsiaSouth Asia (IDA & IBRD)South SudanSpainSri LankaSt. Kitts and NevisSt. LuciaSt. Vincent and the GrenadinesSub-Saharan Africa Sub-Saharan Africa (excluding high income)Sub-Saharan Africa (IDA & IBRD countries)SudanSurinameSwazilandSwedenSwitzerlandSyrian Arab RepublicTajikistanTanzaniaThailandTimor-LesteTogoTongaTrinidad and TobagoTunisiaTurkeyTurkmenistanTurks and Caicos IslandsUgandaUkraineUnited Arab EmiratesUnited KingdomUnited StatesUpper middle incomeUruguayUzbekistanVanuatuVenezuela, RBVietnamWest Bank and GazaWorldYemen, Rep.ZambiaZimbabwe Timeline:
This timeline shows a graph from 1961 to 2014 of Greece. No data until 1960. Number of actual observations by date: 54.
Source name:
World Development Indicators
Source organization:
Carbon Dioxide Information Analysis Center, Environmental Sciences Division, Oak Ridge National Laboratory, Tennessee, United States.
Categories, topics:
Climate Change, Environment
Last updated:
apr 23, 2017
Indicators value changes by year
Minimum:
22.079
jan 1, 1973
Maximum:
42.829
jan 1, 1989
At the date of observation
Value
Absolute change
Change from previous value
jan 1, 1961
33.177
+33.177
0.0%
jan 1, 1962
33.445
+0.268
0.81%
jan 1, 1963
32.468
-0.978
-2.92%
jan 1, 1964
35.687
+3.219
9.91%
jan 1, 1965
37.354
+1.668
4.67%
jan 1, 1966
37.476
+0.121
0.32%
jan 1, 1967
33.838
-3.638
-9.71%
jan 1, 1968
32.345
-1.493
-4.41%
jan 1, 1969
29.834
-2.511
-7.76%
jan 1, 1970
31.409
+1.575
5.28%
jan 1, 1971
23.612
-7.798
-24.83%
jan 1, 1972
24.074
+0.462
1.96%
jan 1, 1973
22.079
-1.995
-8.29%
jan 1, 1974
22.815
+0.736
3.33%
jan 1, 1975
24.846
+2.031
8.9%
jan 1, 1976
29.233
+4.387
17.66%
jan 1, 1977
31.26
+2.027
6.93%
jan 1, 1978
29.367
-1.892
-6.05%
jan 1, 1979
24.825
-4.543
-15.47%
jan 1, 1980
26.43
+1.605
6.47%
jan 1, 1981
24.97
-1.46
-5.52%
jan 1, 1982
28.167
+3.197
12.8%
jan 1, 1983
29.85
+1.684
5.98%
jan 1, 1984
34.535
+4.685
15.69%
jan 1, 1985
36.146
+1.611
4.67%
jan 1, 1986
39.217
+3.071
8.5%
jan 1, 1987
41.209
+1.992
5.08%
jan 1, 1988
41.834
+0.624
1.52%
jan 1, 1989
42.829
+0.996
2.38%
jan 1, 1990
42.373
-0.457
-1.07%
jan 1, 1991
42.733
+0.36
0.85%
jan 1, 1992
41.278
-1.455
-3.4%
jan 1, 1993
42.503
+1.225
2.97%
jan 1, 1994
42.471
-0.032
-0.08%
jan 1, 1995
42.799
+0.328
0.77%
jan 1, 1996
41.901
-0.898
-2.1%
jan 1, 1997
38.932
-2.969
-7.09%
jan 1, 1998
40.201
+1.27
3.26%
jan 1, 1999
40.029
-0.172
-0.43%
jan 1, 2000
38.915
-1.114
-2.78%
jan 1, 2001
38.845
-0.07
-0.18%
jan 1, 2002
39.064
+0.219
0.56%
jan 1, 2003
37.794
-1.271
-3.25%
jan 1, 2004
36.694
-1.1
-2.91%
jan 1, 2005
36.938
+0.244
0.67%
jan 1, 2006
35.772
-1.166
-3.16%
jan 1, 2007
34.222
-1.551
-4.34%
jan 1, 2008
35.511
+1.289
3.77%
jan 1, 2009
34.177
-1.334
-3.76%
jan 1, 2010
36.214
+2.038
5.96%
jan 1, 2011
37.144
+0.93
2.57%
jan 1, 2012
38.571
+1.427
3.84%
jan 1, 2013
40.169
+1.598
4.14%
jan 1, 2014
39.859
-0.31
-0.77%
Ranking of countries by current statistics by years


Comments: