29
/
en
AIzaSyAYiBZKx7MnpbEhh9jyipgxe19OcubqV5w
April 1, 2024
32450
Europe & Central Asia (IDA & IBRD countries)
TEC
false
2
1
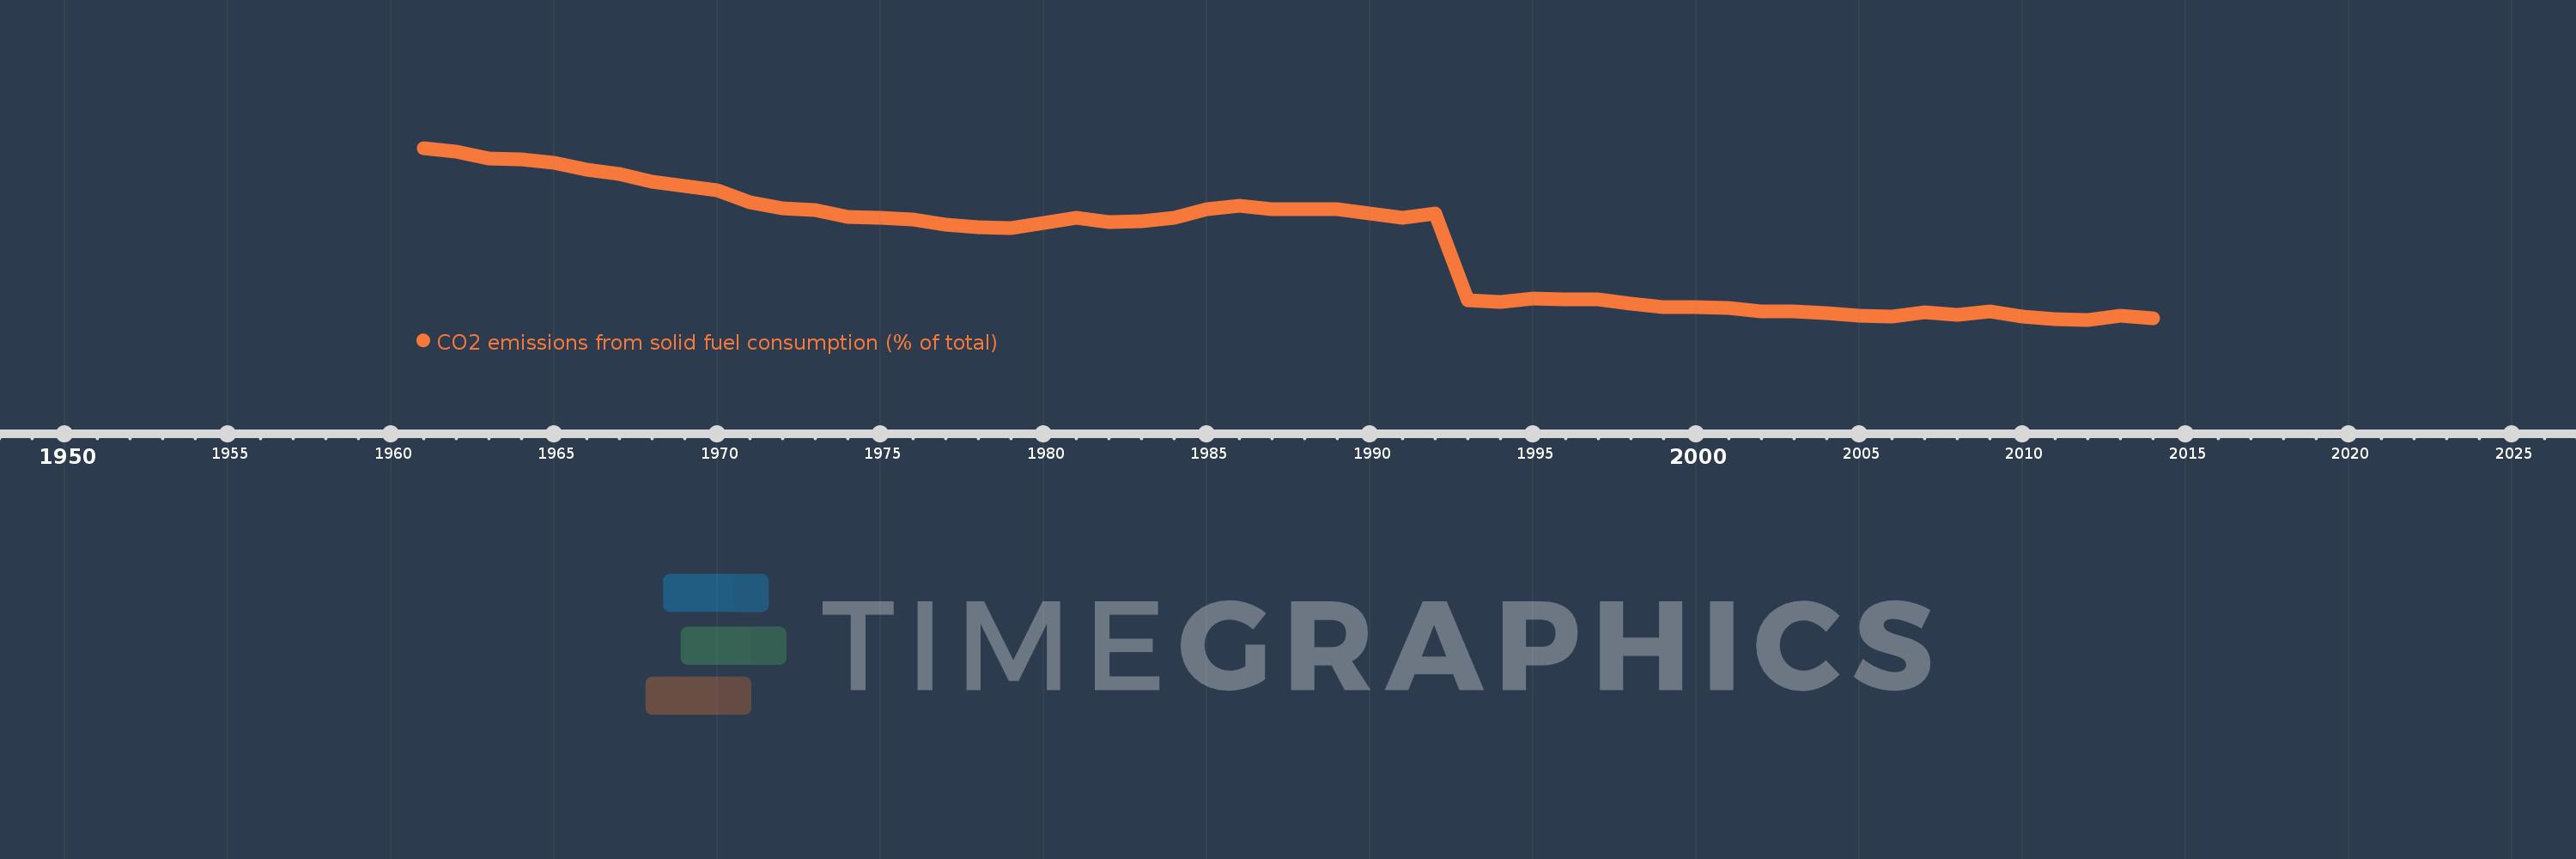
CO2 emissions from solid fuel consumption (% of total)
2014,2013,2012,2011,2010,2009,2008,2007,2006,2005,2004,2003,2002,2001,2000,1999,1998,1997,1996,1995,1994,1993,1992,1991,1990,1989,1988,1987,1986,1985,1984,1983,1982,1981,1980,1979,1978,1977,1976,1975,1974,1973,1972,1971,1970,1969,1968,1967,1966,1965,1964,1963,1962,1961
This statistics in other country:
AfghanistanAlbaniaAlgeriaAndorraAngolaAntigua and BarbudaArab WorldArgentinaArmeniaArubaAustraliaAustriaAzerbaijanBahamas, TheBahrainBangladeshBarbadosBelarusBelgiumBelizeBeninBermudaBhutanBoliviaBosnia and HerzegovinaBotswanaBrazilBritish Virgin IslandsBrunei DarussalamBulgariaBurkina FasoBurundiCabo VerdeCambodiaCameroonCanadaCaribbean small statesCayman IslandsCentral African RepublicCentral Europe and the BalticsChadChileChinaColombiaComorosCongo, Dem. Rep.Congo, Rep.Costa RicaCote d'IvoireCroatiaCubaCuracaoCyprusCzech RepublicDenmarkDjiboutiDominicaDominican RepublicEarly-demographic dividendEast Asia & PacificEast Asia & Pacific (excluding high income)East Asia & Pacific (IDA & IBRD countries)EcuadorEgypt, Arab Rep.El SalvadorEquatorial GuineaEritreaEstoniaEthiopiaEuro areaEurope & Central AsiaEurope & Central Asia (excluding high income)Europe & Central Asia (IDA & IBRD countries)European UnionFaroe IslandsFijiFinlandFragile and conflict affected situationsFranceFrench PolynesiaGabonGambia, TheGeorgiaGermanyGhanaGibraltarGreeceGreenlandGrenadaGuatemalaGuineaGuinea-BissauGuyanaHaitiHeavily indebted poor countries (HIPC)High incomeHondurasHong Kong SAR, ChinaHungaryIBRD onlyIcelandIDA & IBRD totalIDA blendIDA onlyIDA totalIndiaIndonesiaIran, Islamic Rep.IraqIrelandIsraelItalyJamaicaJapanJordanKazakhstanKenyaKiribatiKorea, Dem. People’s Rep.Korea, Rep.KuwaitKyrgyz RepublicLao PDRLate-demographic dividendLatin America & Caribbean Latin America & Caribbean (excluding high income)Latin America & the Caribbean (IDA & IBRD countries)LatviaLeast developed countries: UN classificationLebanonLesothoLiberiaLibyaLiechtensteinLithuaniaLow & middle incomeLow incomeLower middle incomeLuxembourgMacao SAR, ChinaMacedonia, FYRMadagascarMalawiMalaysiaMaldivesMaliMaltaMarshall IslandsMauritaniaMauritiusMexicoMicronesia, Fed. Sts.Middle East & North AfricaMiddle East & North Africa (excluding high income)Middle East & North Africa (IDA & IBRD countries)Middle incomeMoldovaMongoliaMontenegroMoroccoMozambiqueMyanmarNamibiaNauruNepalNetherlandsNew CaledoniaNew ZealandNicaraguaNigerNigeriaNorth AmericaNorwayOECD membersOmanOther small statesPacific island small statesPakistanPalauPanamaPapua New GuineaParaguayPeruPhilippinesPolandPortugalPost-demographic dividendPre-demographic dividendQatarRomaniaRussian FederationRwandaSamoaSao Tome and PrincipeSaudi ArabiaSenegalSerbiaSeychellesSierra LeoneSingaporeSint Maarten (Dutch part)Slovak RepublicSloveniaSmall statesSolomon IslandsSomaliaSouth AfricaSouth AsiaSouth Asia (IDA & IBRD)South SudanSpainSri LankaSt. Kitts and NevisSt. LuciaSt. Vincent and the GrenadinesSub-Saharan Africa Sub-Saharan Africa (excluding high income)Sub-Saharan Africa (IDA & IBRD countries)SudanSurinameSwazilandSwedenSwitzerlandSyrian Arab RepublicTajikistanTanzaniaThailandTimor-LesteTogoTongaTrinidad and TobagoTunisiaTurkeyTurkmenistanTurks and Caicos IslandsUgandaUkraineUnited Arab EmiratesUnited KingdomUnited StatesUpper middle incomeUruguayUzbekistanVanuatuVenezuela, RBVietnamWest Bank and GazaWorldYemen, Rep.ZambiaZimbabwe Timeline:
This timeline shows a graph from 1961 to 2014 of Europe & Central Asia (IDA & IBRD countries). No data until 1960. Number of actual observations by date: 54.
Source name:
World Development Indicators
Source organization:
Carbon Dioxide Information Analysis Center, Environmental Sciences Division, Oak Ridge National Laboratory, Tennessee, United States.
Categories, topics:
Climate Change, Environment
Last updated:
apr 23, 2017
Indicators value changes by year
Minimum:
33.321
jan 1, 2012
Maximum:
79.673
jan 1, 1961
At the date of observation
Value
Absolute change
Change from previous value
jan 1, 1961
79.673
+79.673
0.0%
jan 1, 1962
78.786
-0.887
-1.11%
jan 1, 1963
76.917
-1.869
-2.37%
jan 1, 1964
76.595
-0.322
-0.42%
jan 1, 1965
75.727
-0.868
-1.13%
jan 1, 1966
73.816
-1.911
-2.52%
jan 1, 1967
72.555
-1.261
-1.71%
jan 1, 1968
70.605
-1.95
-2.69%
jan 1, 1969
69.388
-1.216
-1.72%
jan 1, 1970
68.2
-1.188
-1.71%
jan 1, 1971
65.012
-3.188
-4.67%
jan 1, 1972
63.358
-1.655
-2.55%
jan 1, 1973
62.828
-0.529
-0.84%
jan 1, 1974
61.066
-1.762
-2.8%
jan 1, 1975
60.718
-0.348
-0.57%
jan 1, 1976
60.34
-0.379
-0.62%
jan 1, 1977
58.984
-1.355
-2.25%
jan 1, 1978
58.397
-0.587
-1.0%
jan 1, 1979
57.999
-0.398
-0.68%
jan 1, 1980
59.423
+1.424
2.46%
jan 1, 1981
60.748
+1.324
2.23%
jan 1, 1982
59.622
-1.126
-1.85%
jan 1, 1983
59.798
+0.176
0.29%
jan 1, 1984
60.909
+1.111
1.86%
jan 1, 1985
63.218
+2.309
3.79%
jan 1, 1986
64.176
+0.958
1.52%
jan 1, 1987
63.251
-0.925
-1.44%
jan 1, 1988
63.046
-0.206
-0.33%
jan 1, 1989
63.156
+0.11
0.17%
jan 1, 1990
62.006
-1.149
-1.82%
jan 1, 1991
60.94
-1.066
-1.72%
jan 1, 1992
61.972
+1.031
1.69%
jan 1, 1993
38.517
-23.455
-37.85%
jan 1, 1994
38.05
-0.467
-1.21%
jan 1, 1995
39.039
+0.989
2.6%
jan 1, 1996
38.839
-0.2
-0.51%
jan 1, 1997
38.849
+0.01
0.03%
jan 1, 1998
37.573
-1.276
-3.28%
jan 1, 1999
36.663
-0.91
-2.42%
jan 1, 2000
36.676
+0.013
0.04%
jan 1, 2001
36.46
-0.217
-0.59%
jan 1, 2002
35.541
-0.919
-2.52%
jan 1, 2003
35.482
-0.059
-0.17%
jan 1, 2004
35.22
-0.262
-0.74%
jan 1, 2005
34.522
-0.697
-1.98%
jan 1, 2006
34.216
-0.306
-0.89%
jan 1, 2007
35.37
+1.153
3.37%
jan 1, 2008
34.631
-0.738
-2.09%
jan 1, 2009
35.457
+0.826
2.38%
jan 1, 2010
34.143
-1.315
-3.71%
jan 1, 2011
33.495
-0.648
-1.9%
jan 1, 2012
33.321
-0.174
-0.52%
jan 1, 2013
34.477
+1.156
3.47%
jan 1, 2014
33.626
-0.851
-2.47%
Ranking of countries by current statistics by years


Comments: