29
/
en
AIzaSyAYiBZKx7MnpbEhh9jyipgxe19OcubqV5w
April 1, 2024
63119
World
WLD
false
2
1
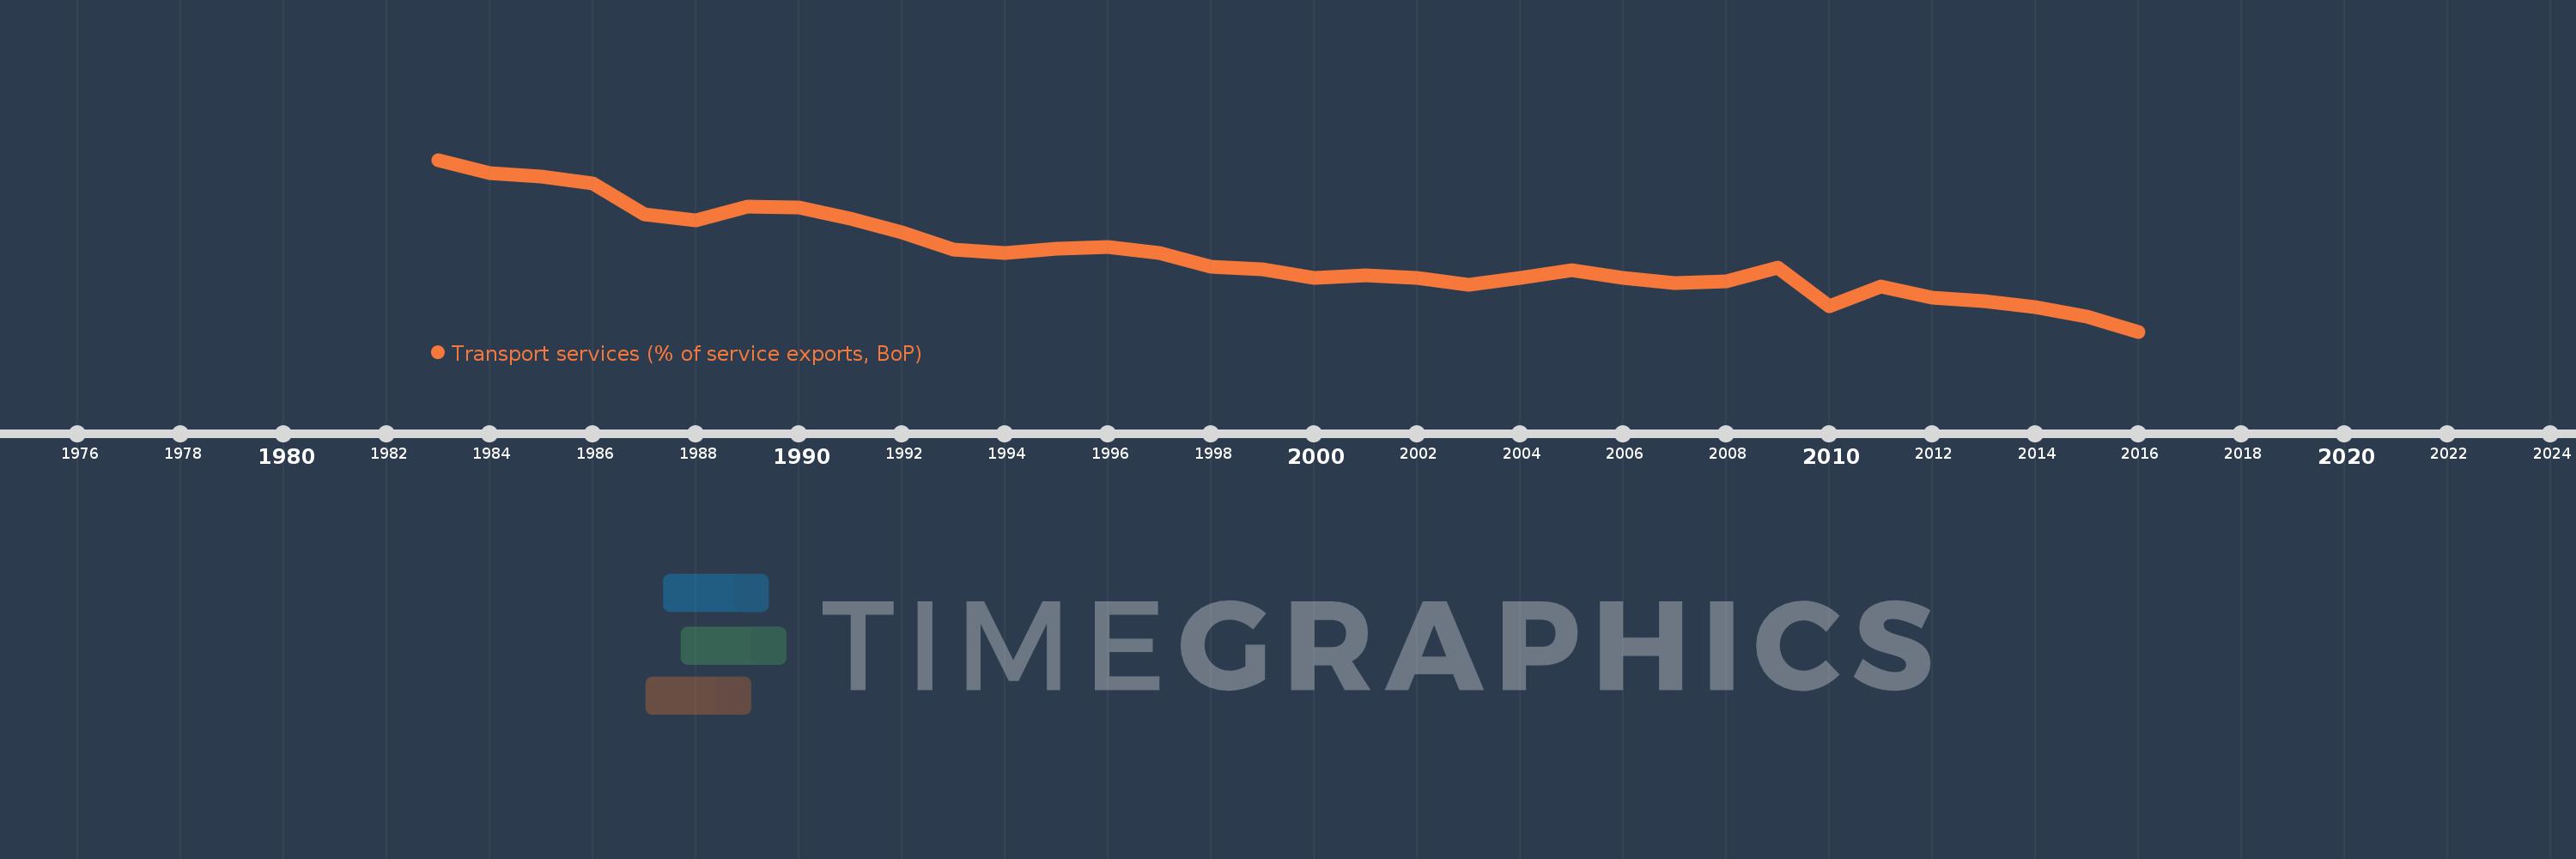
Transport services (% of service exports, BoP)
2016,2015,2014,2013,2012,2011,2010,2009,2008,2007,2006,2005,2004,2003,2002,2001,2000,1999,1998,1997,1996,1995,1994,1993,1992,1991,1990,1989,1988,1987,1986,1985,1984,1983
This statistics in other country:
AfghanistanAlbaniaAlgeriaAngolaAntigua and BarbudaArab WorldArgentinaArmeniaArubaAustraliaAustriaAzerbaijanBahamas, TheBahrainBangladeshBarbadosBelarusBelgiumBelizeBeninBermudaBhutanBoliviaBosnia and HerzegovinaBotswanaBrazilBrunei DarussalamBulgariaBurkina FasoBurundiCabo VerdeCambodiaCameroonCanadaCaribbean small statesCentral African RepublicCentral Europe and the BalticsChadChileChinaColombiaComorosCongo, Dem. Rep.Congo, Rep.Costa RicaCote d'IvoireCroatiaCuracaoCyprusCzech RepublicDenmarkDjiboutiDominicaDominican RepublicEarly-demographic dividendEast Asia & PacificEast Asia & Pacific (excluding high income)East Asia & Pacific (IDA & IBRD countries)EcuadorEgypt, Arab Rep.El SalvadorEritreaEstoniaEthiopiaEuro areaEurope & Central AsiaEurope & Central Asia (excluding high income)Europe & Central Asia (IDA & IBRD countries)European UnionFaroe IslandsFijiFinlandFragile and conflict affected situationsFranceFrench PolynesiaGabonGambia, TheGeorgiaGermanyGhanaGreeceGrenadaGuatemalaGuineaGuinea-BissauGuyanaHaitiHeavily indebted poor countries (HIPC)High incomeHondurasHong Kong SAR, ChinaHungaryIBRD onlyIcelandIDA & IBRD totalIDA onlyIDA totalIndiaIndonesiaIran, Islamic Rep.IraqIrelandIsraelItalyJamaicaJapanJordanKazakhstanKenyaKiribatiKorea, Rep.KosovoKuwaitKyrgyz RepublicLao PDRLate-demographic dividendLatin America & Caribbean Latin America & Caribbean (excluding high income)Latin America & the Caribbean (IDA & IBRD countries)LatviaLeast developed countries: UN classificationLebanonLesothoLiberiaLibyaLithuaniaLow & middle incomeLow incomeLower middle incomeLuxembourgMacao SAR, ChinaMacedonia, FYRMadagascarMalawiMalaysiaMaldivesMaliMaltaMarshall IslandsMauritaniaMauritiusMexicoMicronesia, Fed. Sts.Middle East & North AfricaMiddle East & North Africa (excluding high income)Middle East & North Africa (IDA & IBRD countries)Middle incomeMoldovaMongoliaMontenegroMoroccoMozambiqueMyanmarNamibiaNepalNetherlandsNew CaledoniaNew ZealandNicaraguaNigerNigeriaNorth AmericaNorwayOECD membersOmanOther small statesPacific island small statesPakistanPalauPanamaPapua New GuineaParaguayPeruPhilippinesPolandPortugalPost-demographic dividendPre-demographic dividendQatarRomaniaRussian FederationRwandaSamoaSao Tome and PrincipeSaudi ArabiaSenegalSerbiaSeychellesSierra LeoneSingaporeSint Maarten (Dutch part)Slovak RepublicSloveniaSmall statesSolomon IslandsSouth AfricaSouth AsiaSouth Asia (IDA & IBRD)South SudanSpainSri LankaSt. Kitts and NevisSt. LuciaSt. Vincent and the GrenadinesSub-Saharan Africa Sub-Saharan Africa (excluding high income)Sub-Saharan Africa (IDA & IBRD countries)SudanSurinameSwazilandSwedenSwitzerlandSyrian Arab RepublicTajikistanTanzaniaThailandTimor-LesteTogoTongaTrinidad and TobagoTunisiaTurkeyTuvaluUgandaUkraineUnited KingdomUnited StatesUpper middle incomeUruguayVanuatuVenezuela, RBWest Bank and GazaWorldYemen, Rep.ZambiaZimbabwe Timeline:
This timeline shows a graph from 1983 to 2016 of World. No data until 1982. Number of actual observations by date: 34.
Source name:
World Development Indicators
Source organization:
International Monetary Fund, Balance of Payments Statistics Yearbook and data files.
Categories, topics:
Economy & Growth, Trade
Last updated:
apr 23, 2017
Indicators value changes by year
Minimum:
17.281
jan 1, 2016
Maximum:
30.024
jan 1, 1983
At the date of observation
Value
Absolute change
Change from previous value
jan 1, 1983
30.024
+30.024
0.0%
jan 1, 1984
29.055
-0.969
-3.23%
jan 1, 1985
28.809
-0.246
-0.85%
jan 1, 1986
28.246
-0.563
-1.95%
jan 1, 1987
26.006
-2.24
-7.93%
jan 1, 1988
25.532
-0.474
-1.82%
jan 1, 1989
26.545
+1.013
3.97%
jan 1, 1990
26.47
-0.074
-0.28%
jan 1, 1991
25.651
-0.82
-3.1%
jan 1, 1992
24.641
-1.01
-3.94%
jan 1, 1993
23.36
-1.281
-5.2%
jan 1, 1994
23.137
-0.223
-0.95%
jan 1, 1995
23.401
+0.264
1.14%
jan 1, 1996
23.543
+0.142
0.61%
jan 1, 1997
23.115
-0.428
-1.82%
jan 1, 1998
22.112
-1.003
-4.34%
jan 1, 1999
21.905
-0.207
-0.94%
jan 1, 2000
21.286
-0.619
-2.83%
jan 1, 2001
21.444
+0.158
0.74%
jan 1, 2002
21.238
-0.206
-0.96%
jan 1, 2003
20.754
-0.484
-2.28%
jan 1, 2004
21.243
+0.488
2.35%
jan 1, 2005
21.805
+0.563
2.65%
jan 1, 2006
21.278
-0.527
-2.42%
jan 1, 2007
20.854
-0.425
-2.0%
jan 1, 2008
21.023
+0.17
0.81%
jan 1, 2009
22.003
+0.979
4.66%
jan 1, 2010
19.185
-2.818
-12.81%
jan 1, 2011
20.641
+1.456
7.59%
jan 1, 2012
19.799
-0.842
-4.08%
jan 1, 2013
19.55
-0.249
-1.26%
jan 1, 2014
19.087
-0.462
-2.36%
jan 1, 2015
18.424
-0.663
-3.47%
jan 1, 2016
17.281
-1.143
-6.21%
Ranking of countries by current statistics by years


Comments: