29
/
en
AIzaSyAYiBZKx7MnpbEhh9jyipgxe19OcubqV5w
April 1, 2024
100716
Cameroon
CMR
true
2
1
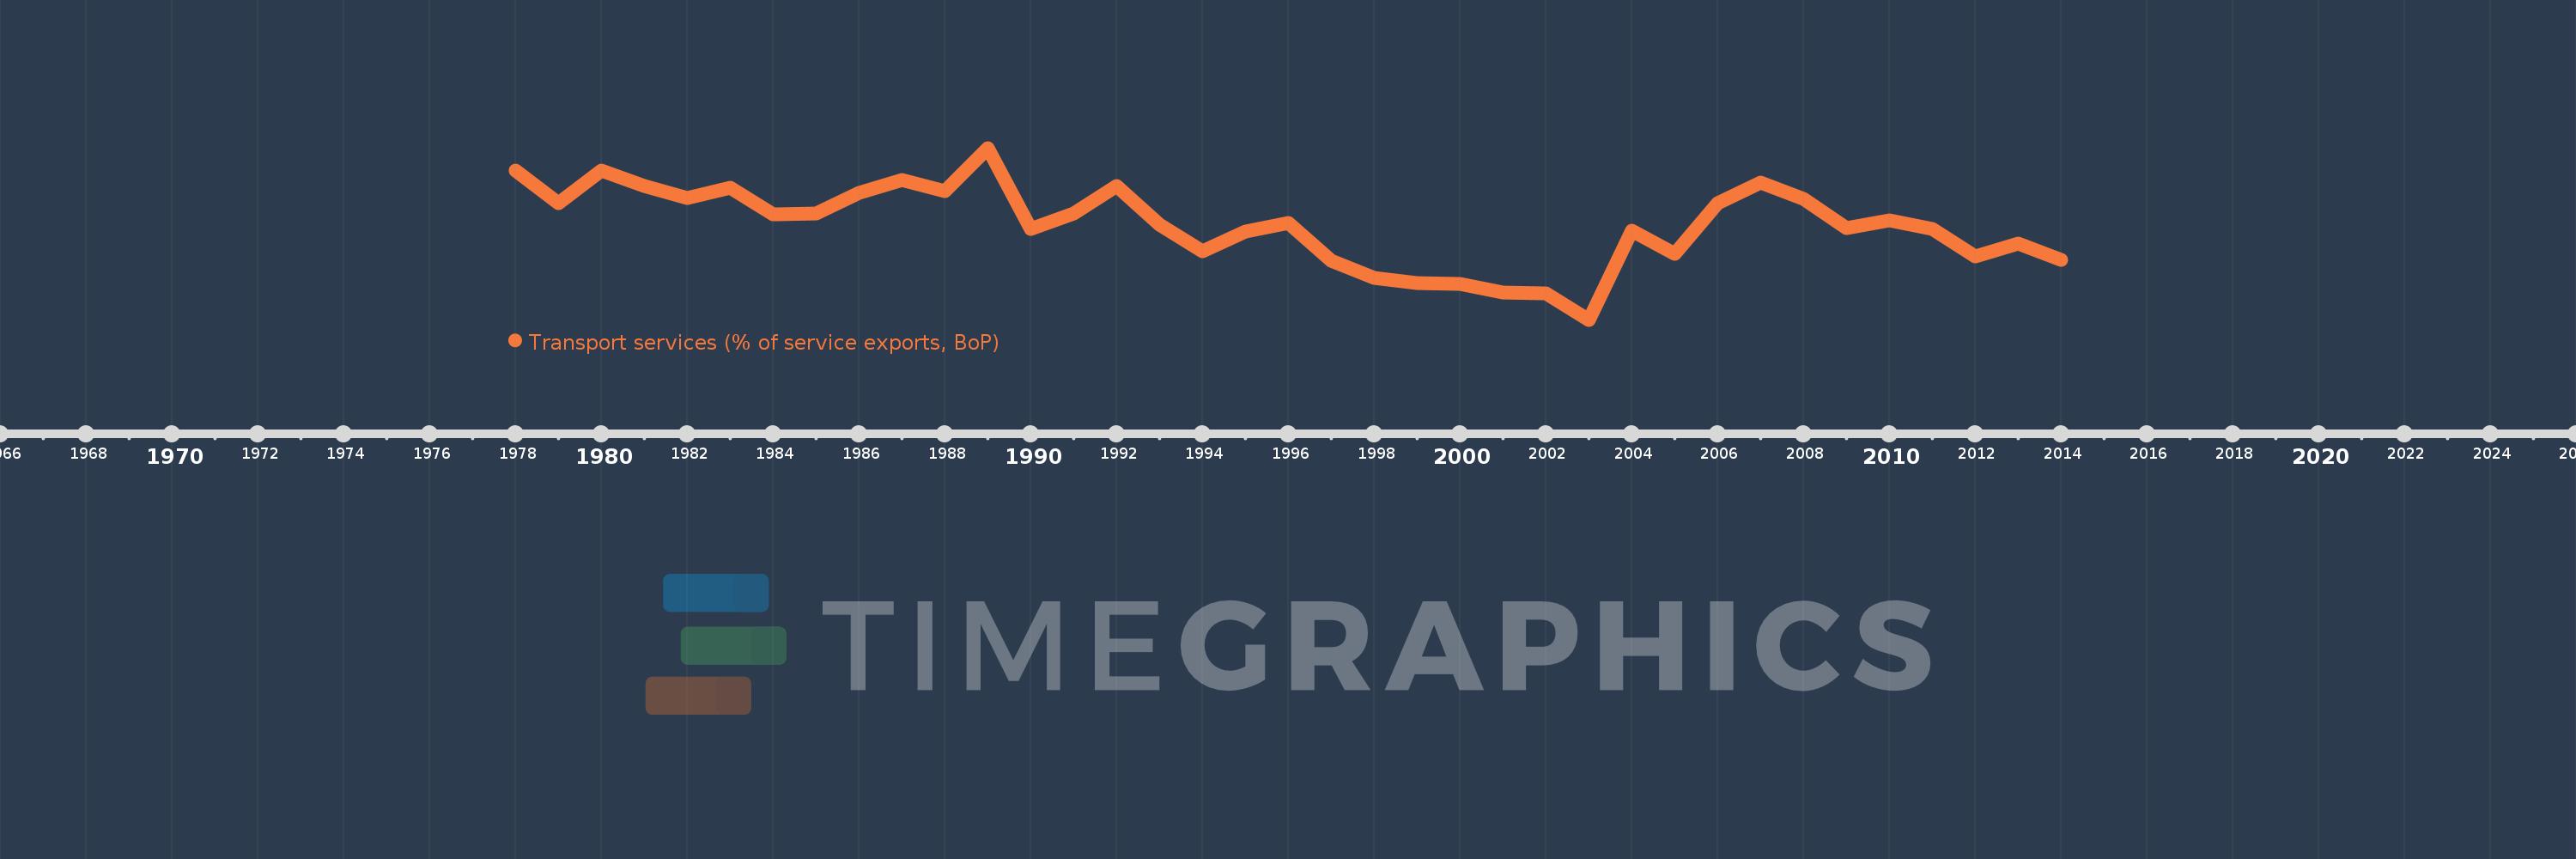
Transport services (% of service exports, BoP)
2014,2013,2012,2011,2010,2009,2008,2007,2006,2005,2004,2003,2002,2001,2000,1999,1998,1997,1996,1995,1994,1993,1992,1991,1990,1989,1988,1987,1986,1985,1984,1983,1982,1981,1980,1979,1978
This statistics in other country:
AfghanistanAlbaniaAlgeriaAngolaAntigua and BarbudaArab WorldArgentinaArmeniaArubaAustraliaAustriaAzerbaijanBahamas, TheBahrainBangladeshBarbadosBelarusBelgiumBelizeBeninBermudaBhutanBoliviaBosnia and HerzegovinaBotswanaBrazilBrunei DarussalamBulgariaBurkina FasoBurundiCabo VerdeCambodiaCameroonCanadaCaribbean small statesCentral African RepublicCentral Europe and the BalticsChadChileChinaColombiaComorosCongo, Dem. Rep.Congo, Rep.Costa RicaCote d'IvoireCroatiaCuracaoCyprusCzech RepublicDenmarkDjiboutiDominicaDominican RepublicEarly-demographic dividendEast Asia & PacificEast Asia & Pacific (excluding high income)East Asia & Pacific (IDA & IBRD countries)EcuadorEgypt, Arab Rep.El SalvadorEritreaEstoniaEthiopiaEuro areaEurope & Central AsiaEurope & Central Asia (excluding high income)Europe & Central Asia (IDA & IBRD countries)European UnionFaroe IslandsFijiFinlandFragile and conflict affected situationsFranceFrench PolynesiaGabonGambia, TheGeorgiaGermanyGhanaGreeceGrenadaGuatemalaGuineaGuinea-BissauGuyanaHaitiHeavily indebted poor countries (HIPC)High incomeHondurasHong Kong SAR, ChinaHungaryIBRD onlyIcelandIDA & IBRD totalIDA onlyIDA totalIndiaIndonesiaIran, Islamic Rep.IraqIrelandIsraelItalyJamaicaJapanJordanKazakhstanKenyaKiribatiKorea, Rep.KosovoKuwaitKyrgyz RepublicLao PDRLate-demographic dividendLatin America & Caribbean Latin America & Caribbean (excluding high income)Latin America & the Caribbean (IDA & IBRD countries)LatviaLeast developed countries: UN classificationLebanonLesothoLiberiaLibyaLithuaniaLow & middle incomeLow incomeLower middle incomeLuxembourgMacao SAR, ChinaMacedonia, FYRMadagascarMalawiMalaysiaMaldivesMaliMaltaMarshall IslandsMauritaniaMauritiusMexicoMicronesia, Fed. Sts.Middle East & North AfricaMiddle East & North Africa (excluding high income)Middle East & North Africa (IDA & IBRD countries)Middle incomeMoldovaMongoliaMontenegroMoroccoMozambiqueMyanmarNamibiaNepalNetherlandsNew CaledoniaNew ZealandNicaraguaNigerNigeriaNorth AmericaNorwayOECD membersOmanOther small statesPacific island small statesPakistanPalauPanamaPapua New GuineaParaguayPeruPhilippinesPolandPortugalPost-demographic dividendPre-demographic dividendQatarRomaniaRussian FederationRwandaSamoaSao Tome and PrincipeSaudi ArabiaSenegalSerbiaSeychellesSierra LeoneSingaporeSint Maarten (Dutch part)Slovak RepublicSloveniaSmall statesSolomon IslandsSouth AfricaSouth AsiaSouth Asia (IDA & IBRD)South SudanSpainSri LankaSt. Kitts and NevisSt. LuciaSt. Vincent and the GrenadinesSub-Saharan Africa Sub-Saharan Africa (excluding high income)Sub-Saharan Africa (IDA & IBRD countries)SudanSurinameSwazilandSwedenSwitzerlandSyrian Arab RepublicTajikistanTanzaniaThailandTimor-LesteTogoTongaTrinidad and TobagoTunisiaTurkeyTuvaluUgandaUkraineUnited KingdomUnited StatesUpper middle incomeUruguayVanuatuVenezuela, RBWest Bank and GazaWorldYemen, Rep.ZambiaZimbabwe Timeline:
This timeline shows a graph from 1978 to 2014 of Cameroon. No data until 1977. Number of actual observations by date: 37.
Source name:
World Development Indicators
Source organization:
International Monetary Fund, Balance of Payments Statistics Yearbook and data files.
Categories, topics:
Economy & Growth, Trade
Last updated:
apr 23, 2017
Indicators value changes by year
Maximum:
58.768
jan 1, 1989
At the date of observation
Value
Absolute change
Change from previous value
jan 1, 1978
52.712
+52.712
0.0%
jan 1, 1979
43.778
-8.934
-16.95%
jan 1, 1980
52.687
+8.909
20.35%
jan 1, 1981
48.438
-4.249
-8.06%
jan 1, 1982
45.218
-3.221
-6.65%
jan 1, 1983
48.116
+2.899
6.41%
jan 1, 1984
40.965
-7.152
-14.86%
jan 1, 1985
41.017
+0.052
0.13%
jan 1, 1986
46.636
+5.62
13.7%
jan 1, 1987
50.09
+3.453
7.4%
jan 1, 1988
47.061
-3.029
-6.05%
jan 1, 1989
58.768
+11.707
24.88%
jan 1, 1990
36.946
-21.822
-37.13%
jan 1, 1991
41.105
+4.159
11.26%
jan 1, 1992
48.494
+7.389
17.97%
jan 1, 1993
38.09
-10.404
-21.45%
jan 1, 1994
30.822
-7.268
-19.08%
jan 1, 1995
36.155
+5.333
17.3%
jan 1, 1996
38.478
+2.323
6.43%
jan 1, 1997
28.392
-10.086
-26.21%
jan 1, 1998
23.736
-4.657
-16.4%
jan 1, 1999
22.417
-1.318
-5.55%
jan 1, 2000
22.117
-0.3
-1.34%
jan 1, 2001
19.754
-2.363
-10.68%
jan 1, 2002
19.586
-0.169
-0.85%
jan 1, 2003
12.49
-7.095
-36.23%
jan 1, 2004
36.489
+23.998
192.13%
jan 1, 2005
30.229
-6.26
-17.16%
jan 1, 2006
43.804
+13.575
44.91%
jan 1, 2007
49.439
+5.635
12.86%
jan 1, 2008
45.151
-4.288
-8.67%
jan 1, 2009
37.284
-7.867
-17.42%
jan 1, 2010
39.28
+1.996
5.35%
jan 1, 2011
36.939
-2.341
-5.96%
jan 1, 2012
29.517
-7.421
-20.09%
jan 1, 2013
32.977
+3.459
11.72%
jan 1, 2014
28.693
-4.283
-12.99%
Ranking of countries by current statistics by years


Comments: