29
/
en
AIzaSyAYiBZKx7MnpbEhh9jyipgxe19OcubqV5w
April 1, 2024
62289
Upper middle income
UMC
false
2
1
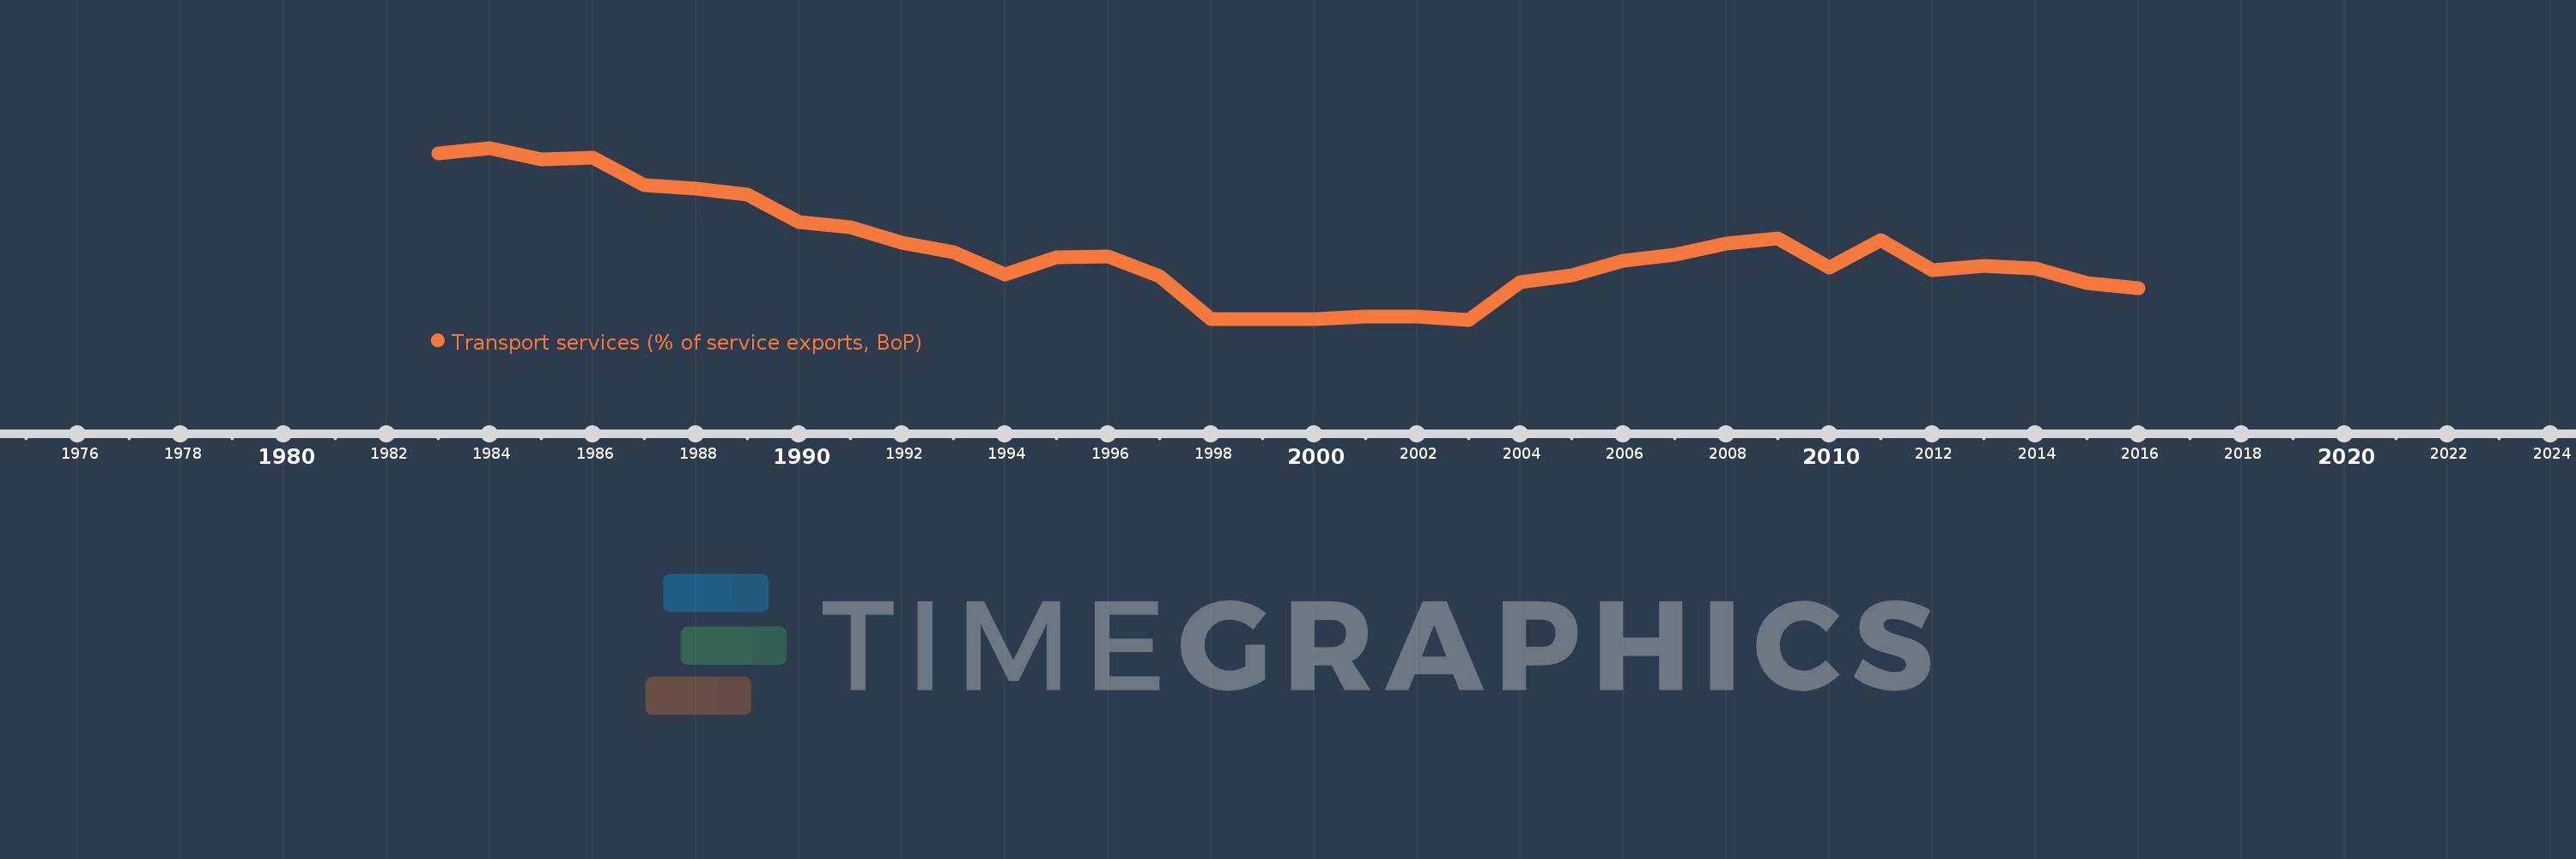
Transport services (% of service exports, BoP)
2016,2015,2014,2013,2012,2011,2010,2009,2008,2007,2006,2005,2004,2003,2002,2001,2000,1999,1998,1997,1996,1995,1994,1993,1992,1991,1990,1989,1988,1987,1986,1985,1984,1983
This statistics in other country:
AfghanistanAlbaniaAlgeriaAngolaAntigua and BarbudaArab WorldArgentinaArmeniaArubaAustraliaAustriaAzerbaijanBahamas, TheBahrainBangladeshBarbadosBelarusBelgiumBelizeBeninBermudaBhutanBoliviaBosnia and HerzegovinaBotswanaBrazilBrunei DarussalamBulgariaBurkina FasoBurundiCabo VerdeCambodiaCameroonCanadaCaribbean small statesCentral African RepublicCentral Europe and the BalticsChadChileChinaColombiaComorosCongo, Dem. Rep.Congo, Rep.Costa RicaCote d'IvoireCroatiaCuracaoCyprusCzech RepublicDenmarkDjiboutiDominicaDominican RepublicEarly-demographic dividendEast Asia & PacificEast Asia & Pacific (excluding high income)East Asia & Pacific (IDA & IBRD countries)EcuadorEgypt, Arab Rep.El SalvadorEritreaEstoniaEthiopiaEuro areaEurope & Central AsiaEurope & Central Asia (excluding high income)Europe & Central Asia (IDA & IBRD countries)European UnionFaroe IslandsFijiFinlandFragile and conflict affected situationsFranceFrench PolynesiaGabonGambia, TheGeorgiaGermanyGhanaGreeceGrenadaGuatemalaGuineaGuinea-BissauGuyanaHaitiHeavily indebted poor countries (HIPC)High incomeHondurasHong Kong SAR, ChinaHungaryIBRD onlyIcelandIDA & IBRD totalIDA onlyIDA totalIndiaIndonesiaIran, Islamic Rep.IraqIrelandIsraelItalyJamaicaJapanJordanKazakhstanKenyaKiribatiKorea, Rep.KosovoKuwaitKyrgyz RepublicLao PDRLate-demographic dividendLatin America & Caribbean Latin America & Caribbean (excluding high income)Latin America & the Caribbean (IDA & IBRD countries)LatviaLeast developed countries: UN classificationLebanonLesothoLiberiaLibyaLithuaniaLow & middle incomeLow incomeLower middle incomeLuxembourgMacao SAR, ChinaMacedonia, FYRMadagascarMalawiMalaysiaMaldivesMaliMaltaMarshall IslandsMauritaniaMauritiusMexicoMicronesia, Fed. Sts.Middle East & North AfricaMiddle East & North Africa (excluding high income)Middle East & North Africa (IDA & IBRD countries)Middle incomeMoldovaMongoliaMontenegroMoroccoMozambiqueMyanmarNamibiaNepalNetherlandsNew CaledoniaNew ZealandNicaraguaNigerNigeriaNorth AmericaNorwayOECD membersOmanOther small statesPacific island small statesPakistanPalauPanamaPapua New GuineaParaguayPeruPhilippinesPolandPortugalPost-demographic dividendPre-demographic dividendQatarRomaniaRussian FederationRwandaSamoaSao Tome and PrincipeSaudi ArabiaSenegalSerbiaSeychellesSierra LeoneSingaporeSint Maarten (Dutch part)Slovak RepublicSloveniaSmall statesSolomon IslandsSouth AfricaSouth AsiaSouth Asia (IDA & IBRD)South SudanSpainSri LankaSt. Kitts and NevisSt. LuciaSt. Vincent and the GrenadinesSub-Saharan Africa Sub-Saharan Africa (excluding high income)Sub-Saharan Africa (IDA & IBRD countries)SudanSurinameSwazilandSwedenSwitzerlandSyrian Arab RepublicTajikistanTanzaniaThailandTimor-LesteTogoTongaTrinidad and TobagoTunisiaTurkeyTuvaluUgandaUkraineUnited KingdomUnited StatesUpper middle incomeUruguayVanuatuVenezuela, RBWest Bank and GazaWorldYemen, Rep.ZambiaZimbabwe Timeline:
This timeline shows a graph from 1983 to 2016 of Upper middle income. No data until 1982. Number of actual observations by date: 34.
Source name:
World Development Indicators
Source organization:
International Monetary Fund, Balance of Payments Statistics Yearbook and data files.
Categories, topics:
Economy & Growth, Trade
Last updated:
apr 23, 2017
Indicators value changes by year
Minimum:
14.069
jan 1, 2003
Maximum:
33.016
jan 1, 1984
At the date of observation
Value
Absolute change
Change from previous value
jan 1, 1983
32.383
+32.383
0.0%
jan 1, 1984
33.016
+0.632
1.95%
jan 1, 1985
31.736
-1.279
-3.88%
jan 1, 1986
31.936
+0.2
0.63%
jan 1, 1987
28.9
-3.036
-9.51%
jan 1, 1988
28.503
-0.397
-1.37%
jan 1, 1989
27.89
-0.613
-2.15%
jan 1, 1990
24.798
-3.092
-11.09%
jan 1, 1991
24.256
-0.542
-2.19%
jan 1, 1992
22.583
-1.673
-6.9%
jan 1, 1993
21.55
-1.033
-4.57%
jan 1, 1994
19.035
-2.515
-11.67%
jan 1, 1995
20.944
+1.909
10.03%
jan 1, 1996
21.064
+0.12
0.57%
jan 1, 1997
18.887
-2.177
-10.34%
jan 1, 1998
14.109
-4.778
-25.3%
jan 1, 1999
14.169
+0.061
0.43%
jan 1, 2000
14.159
-0.011
-0.08%
jan 1, 2001
14.407
+0.248
1.75%
jan 1, 2002
14.389
-0.018
-0.12%
jan 1, 2003
14.069
-0.319
-2.22%
jan 1, 2004
18.179
+4.11
29.21%
jan 1, 2005
18.982
+0.803
4.41%
jan 1, 2006
20.594
+1.612
8.49%
jan 1, 2007
21.239
+0.644
3.13%
jan 1, 2008
22.457
+1.218
5.73%
jan 1, 2009
23.027
+0.571
2.54%
jan 1, 2010
19.812
-3.215
-13.96%
jan 1, 2011
22.824
+3.011
15.2%
jan 1, 2012
19.517
-3.307
-14.49%
jan 1, 2013
19.988
+0.472
2.42%
jan 1, 2014
19.687
-0.301
-1.5%
jan 1, 2015
18.158
-1.529
-7.77%
jan 1, 2016
17.584
-0.575
-3.17%
Ranking of countries by current statistics by years


Comments: