29
/
en
AIzaSyAYiBZKx7MnpbEhh9jyipgxe19OcubqV5w
April 1, 2024
214896
Norway
NOR
true
2
1
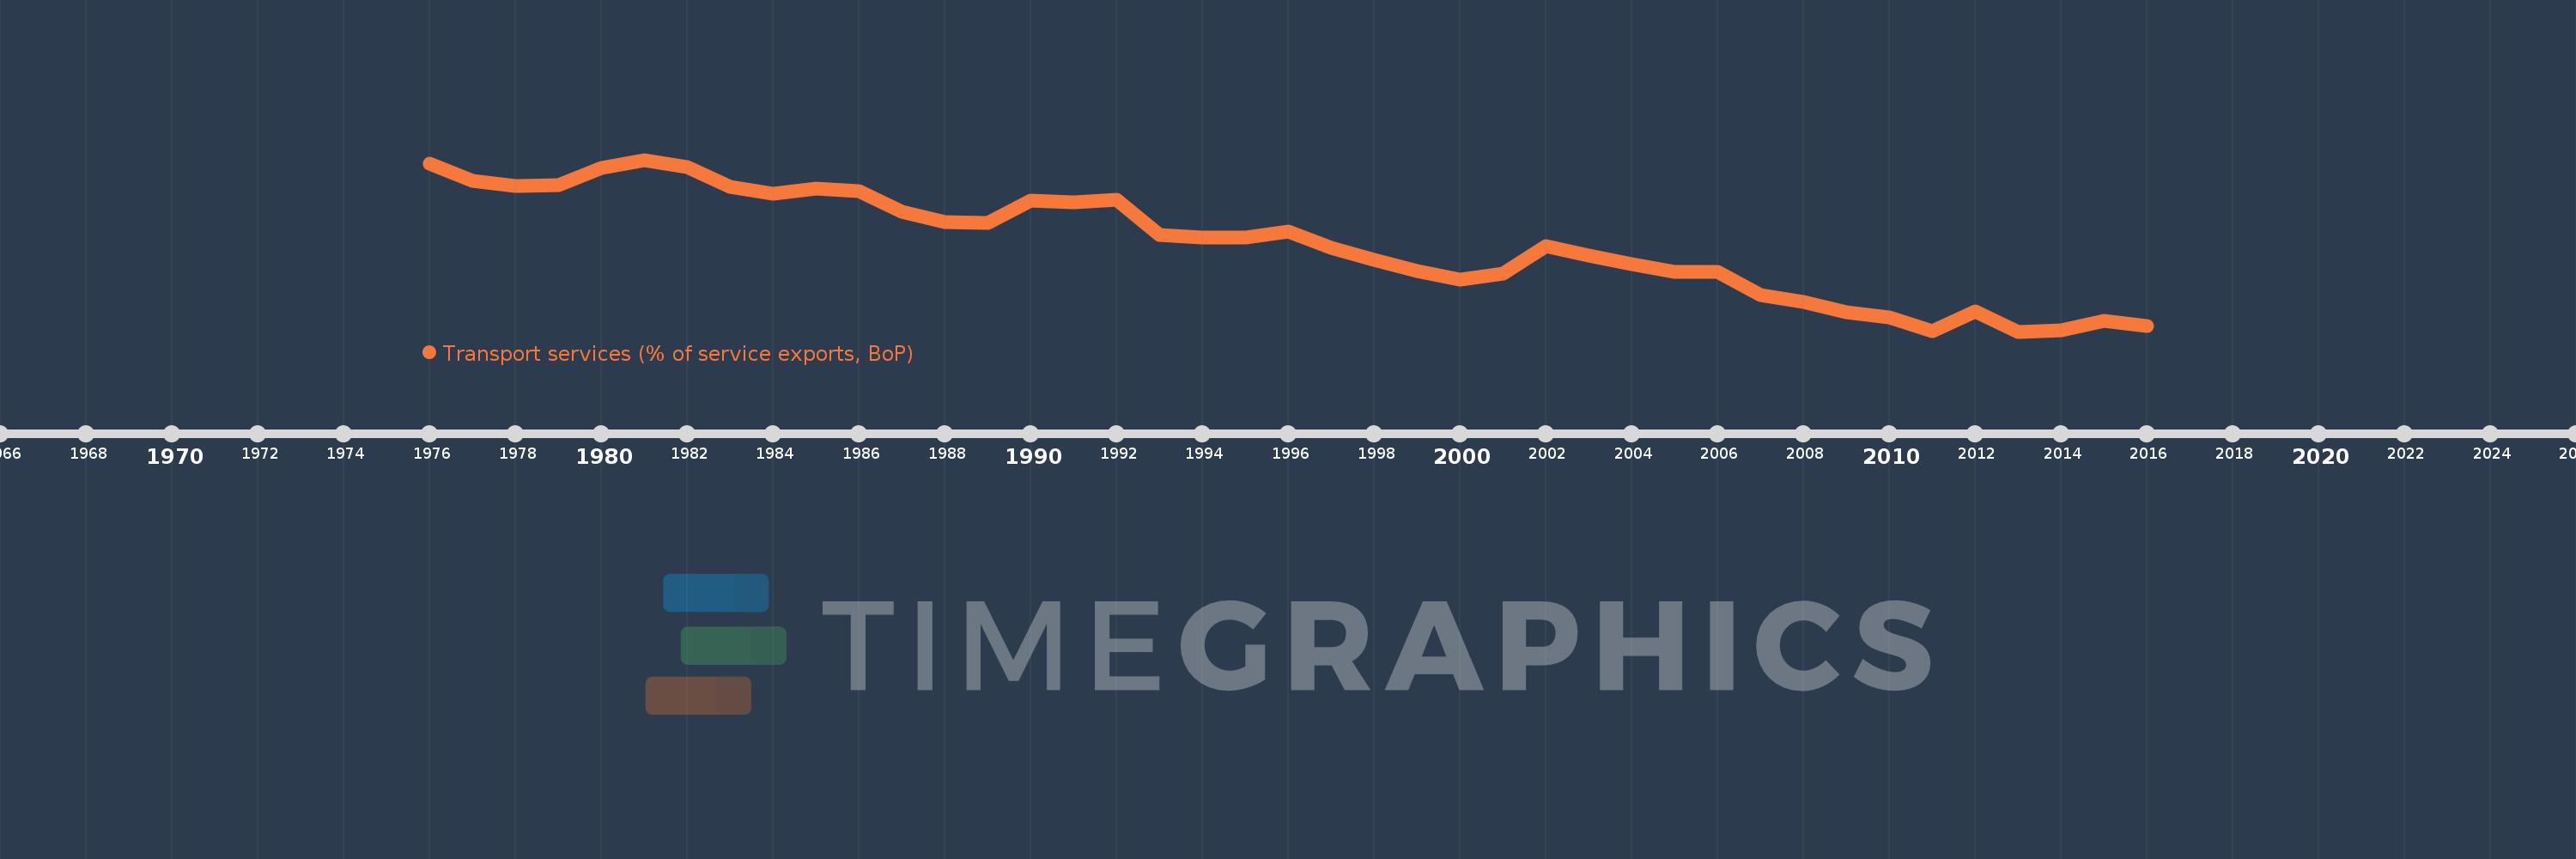
Transport services (% of service exports, BoP)
2016,2015,2014,2013,2012,2011,2010,2009,2008,2007,2006,2005,2004,2003,2002,2001,2000,1999,1998,1997,1996,1995,1994,1993,1992,1991,1990,1989,1988,1987,1986,1985,1984,1983,1982,1981,1980,1979,1978,1977,1976
This statistics in other country:
AfghanistanAlbaniaAlgeriaAngolaAntigua and BarbudaArab WorldArgentinaArmeniaArubaAustraliaAustriaAzerbaijanBahamas, TheBahrainBangladeshBarbadosBelarusBelgiumBelizeBeninBermudaBhutanBoliviaBosnia and HerzegovinaBotswanaBrazilBrunei DarussalamBulgariaBurkina FasoBurundiCabo VerdeCambodiaCameroonCanadaCaribbean small statesCentral African RepublicCentral Europe and the BalticsChadChileChinaColombiaComorosCongo, Dem. Rep.Congo, Rep.Costa RicaCote d'IvoireCroatiaCuracaoCyprusCzech RepublicDenmarkDjiboutiDominicaDominican RepublicEarly-demographic dividendEast Asia & PacificEast Asia & Pacific (excluding high income)East Asia & Pacific (IDA & IBRD countries)EcuadorEgypt, Arab Rep.El SalvadorEritreaEstoniaEthiopiaEuro areaEurope & Central AsiaEurope & Central Asia (excluding high income)Europe & Central Asia (IDA & IBRD countries)European UnionFaroe IslandsFijiFinlandFragile and conflict affected situationsFranceFrench PolynesiaGabonGambia, TheGeorgiaGermanyGhanaGreeceGrenadaGuatemalaGuineaGuinea-BissauGuyanaHaitiHeavily indebted poor countries (HIPC)High incomeHondurasHong Kong SAR, ChinaHungaryIBRD onlyIcelandIDA & IBRD totalIDA onlyIDA totalIndiaIndonesiaIran, Islamic Rep.IraqIrelandIsraelItalyJamaicaJapanJordanKazakhstanKenyaKiribatiKorea, Rep.KosovoKuwaitKyrgyz RepublicLao PDRLate-demographic dividendLatin America & Caribbean Latin America & Caribbean (excluding high income)Latin America & the Caribbean (IDA & IBRD countries)LatviaLeast developed countries: UN classificationLebanonLesothoLiberiaLibyaLithuaniaLow & middle incomeLow incomeLower middle incomeLuxembourgMacao SAR, ChinaMacedonia, FYRMadagascarMalawiMalaysiaMaldivesMaliMaltaMarshall IslandsMauritaniaMauritiusMexicoMicronesia, Fed. Sts.Middle East & North AfricaMiddle East & North Africa (excluding high income)Middle East & North Africa (IDA & IBRD countries)Middle incomeMoldovaMongoliaMontenegroMoroccoMozambiqueMyanmarNamibiaNepalNetherlandsNew CaledoniaNew ZealandNicaraguaNigerNigeriaNorth AmericaNorwayOECD membersOmanOther small statesPacific island small statesPakistanPalauPanamaPapua New GuineaParaguayPeruPhilippinesPolandPortugalPost-demographic dividendPre-demographic dividendQatarRomaniaRussian FederationRwandaSamoaSao Tome and PrincipeSaudi ArabiaSenegalSerbiaSeychellesSierra LeoneSingaporeSint Maarten (Dutch part)Slovak RepublicSloveniaSmall statesSolomon IslandsSouth AfricaSouth AsiaSouth Asia (IDA & IBRD)South SudanSpainSri LankaSt. Kitts and NevisSt. LuciaSt. Vincent and the GrenadinesSub-Saharan Africa Sub-Saharan Africa (excluding high income)Sub-Saharan Africa (IDA & IBRD countries)SudanSurinameSwazilandSwedenSwitzerlandSyrian Arab RepublicTajikistanTanzaniaThailandTimor-LesteTogoTongaTrinidad and TobagoTunisiaTurkeyTuvaluUgandaUkraineUnited KingdomUnited StatesUpper middle incomeUruguayVanuatuVenezuela, RBWest Bank and GazaWorldYemen, Rep.ZambiaZimbabwe Timeline:
This timeline shows a graph from 1976 to 2016 of Norway. No data until 1975. Number of actual observations by date: 41.
Source name:
World Development Indicators
Source organization:
International Monetary Fund, Balance of Payments Statistics Yearbook and data files.
Categories, topics:
Economy & Growth, Trade
Last updated:
apr 23, 2017
Indicators value changes by year
Minimum:
43.925
jan 1, 2013
Maximum:
74.535
jan 1, 1981
At the date of observation
Value
Absolute change
Change from previous value
jan 1, 1976
73.803
+73.803
0.0%
jan 1, 1977
70.732
-3.071
-4.16%
jan 1, 1978
69.849
-0.882
-1.25%
jan 1, 1979
69.971
+0.122
0.17%
jan 1, 1980
73.123
+3.152
4.5%
jan 1, 1981
74.535
+1.412
1.93%
jan 1, 1982
73.197
-1.337
-1.79%
jan 1, 1983
69.737
-3.46
-4.73%
jan 1, 1984
68.474
-1.262
-1.81%
jan 1, 1985
69.413
+0.939
1.37%
jan 1, 1986
68.981
-0.432
-0.62%
jan 1, 1987
65.339
-3.642
-5.28%
jan 1, 1988
63.385
-1.954
-2.99%
jan 1, 1989
63.218
-0.167
-0.26%
jan 1, 1990
67.293
+4.076
6.45%
jan 1, 1991
67.013
-0.28
-0.42%
jan 1, 1992
67.453
+0.44
0.66%
jan 1, 1993
61.192
-6.261
-9.28%
jan 1, 1994
60.679
-0.513
-0.84%
jan 1, 1995
60.72
+0.041
0.07%
jan 1, 1996
61.785
+1.065
1.75%
jan 1, 1997
58.869
-2.916
-4.72%
jan 1, 1998
56.667
-2.203
-3.74%
jan 1, 1999
54.786
-1.881
-3.32%
jan 1, 2000
53.156
-1.63
-2.98%
jan 1, 2001
54.263
+1.107
2.08%
jan 1, 2002
59.097
+4.834
8.91%
jan 1, 2003
57.411
-1.686
-2.85%
jan 1, 2004
55.996
-1.415
-2.46%
jan 1, 2005
54.622
-1.374
-2.45%
jan 1, 2006
54.564
-0.058
-0.11%
jan 1, 2007
50.375
-4.189
-7.68%
jan 1, 2008
49.277
-1.098
-2.18%
jan 1, 2009
47.356
-1.921
-3.9%
jan 1, 2010
46.467
-0.89
-1.88%
jan 1, 2011
44.054
-2.413
-5.19%
jan 1, 2012
47.483
+3.429
7.78%
jan 1, 2013
43.925
-3.559
-7.49%
jan 1, 2014
44.097
+0.172
0.39%
jan 1, 2015
45.906
+1.809
4.1%
jan 1, 2016
44.85
-1.056
-2.3%
Ranking of countries by current statistics by years


Comments: