29
/
en
AIzaSyAYiBZKx7MnpbEhh9jyipgxe19OcubqV5w
April 1, 2024
199977
Mongolia
MNG
true
2
1
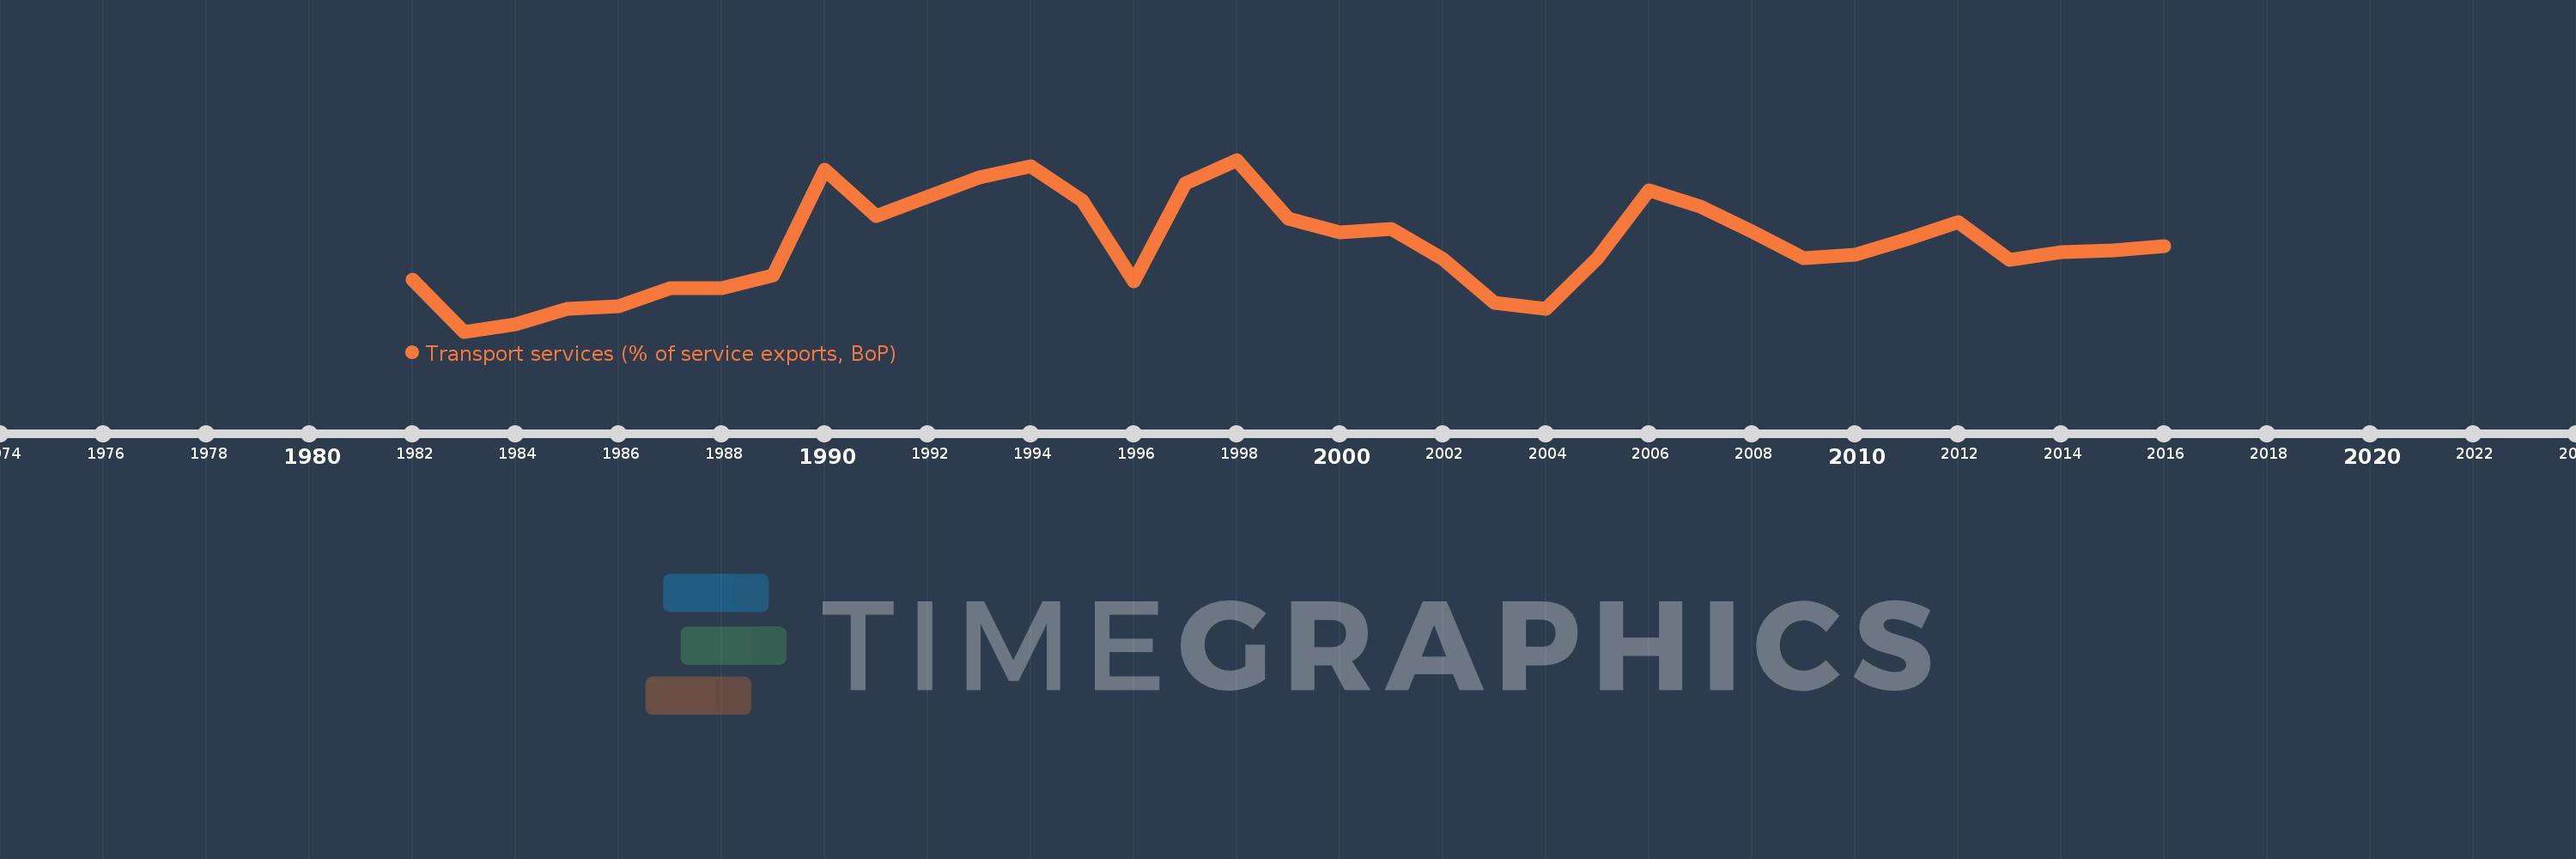
Transport services (% of service exports, BoP)
2016,2015,2014,2013,2012,2011,2010,2009,2008,2007,2006,2005,2004,2003,2002,2001,2000,1999,1998,1997,1996,1995,1994,1993,1991,1990,1989,1988,1987,1986,1985,1984,1983,1982
This statistics in other country:
AfghanistanAlbaniaAlgeriaAngolaAntigua and BarbudaArab WorldArgentinaArmeniaArubaAustraliaAustriaAzerbaijanBahamas, TheBahrainBangladeshBarbadosBelarusBelgiumBelizeBeninBermudaBhutanBoliviaBosnia and HerzegovinaBotswanaBrazilBrunei DarussalamBulgariaBurkina FasoBurundiCabo VerdeCambodiaCameroonCanadaCaribbean small statesCentral African RepublicCentral Europe and the BalticsChadChileChinaColombiaComorosCongo, Dem. Rep.Congo, Rep.Costa RicaCote d'IvoireCroatiaCuracaoCyprusCzech RepublicDenmarkDjiboutiDominicaDominican RepublicEarly-demographic dividendEast Asia & PacificEast Asia & Pacific (excluding high income)East Asia & Pacific (IDA & IBRD countries)EcuadorEgypt, Arab Rep.El SalvadorEritreaEstoniaEthiopiaEuro areaEurope & Central AsiaEurope & Central Asia (excluding high income)Europe & Central Asia (IDA & IBRD countries)European UnionFaroe IslandsFijiFinlandFragile and conflict affected situationsFranceFrench PolynesiaGabonGambia, TheGeorgiaGermanyGhanaGreeceGrenadaGuatemalaGuineaGuinea-BissauGuyanaHaitiHeavily indebted poor countries (HIPC)High incomeHondurasHong Kong SAR, ChinaHungaryIBRD onlyIcelandIDA & IBRD totalIDA onlyIDA totalIndiaIndonesiaIran, Islamic Rep.IraqIrelandIsraelItalyJamaicaJapanJordanKazakhstanKenyaKiribatiKorea, Rep.KosovoKuwaitKyrgyz RepublicLao PDRLate-demographic dividendLatin America & Caribbean Latin America & Caribbean (excluding high income)Latin America & the Caribbean (IDA & IBRD countries)LatviaLeast developed countries: UN classificationLebanonLesothoLiberiaLibyaLithuaniaLow & middle incomeLow incomeLower middle incomeLuxembourgMacao SAR, ChinaMacedonia, FYRMadagascarMalawiMalaysiaMaldivesMaliMaltaMarshall IslandsMauritaniaMauritiusMexicoMicronesia, Fed. Sts.Middle East & North AfricaMiddle East & North Africa (excluding high income)Middle East & North Africa (IDA & IBRD countries)Middle incomeMoldovaMongoliaMontenegroMoroccoMozambiqueMyanmarNamibiaNepalNetherlandsNew CaledoniaNew ZealandNicaraguaNigerNigeriaNorth AmericaNorwayOECD membersOmanOther small statesPacific island small statesPakistanPalauPanamaPapua New GuineaParaguayPeruPhilippinesPolandPortugalPost-demographic dividendPre-demographic dividendQatarRomaniaRussian FederationRwandaSamoaSao Tome and PrincipeSaudi ArabiaSenegalSerbiaSeychellesSierra LeoneSingaporeSint Maarten (Dutch part)Slovak RepublicSloveniaSmall statesSolomon IslandsSouth AfricaSouth AsiaSouth Asia (IDA & IBRD)South SudanSpainSri LankaSt. Kitts and NevisSt. LuciaSt. Vincent and the GrenadinesSub-Saharan Africa Sub-Saharan Africa (excluding high income)Sub-Saharan Africa (IDA & IBRD countries)SudanSurinameSwazilandSwedenSwitzerlandSyrian Arab RepublicTajikistanTanzaniaThailandTimor-LesteTogoTongaTrinidad and TobagoTunisiaTurkeyTuvaluUgandaUkraineUnited KingdomUnited StatesUpper middle incomeUruguayVanuatuVenezuela, RBWest Bank and GazaWorldYemen, Rep.ZambiaZimbabwe Timeline:
This timeline shows a graph from 1982 to 2016 of Mongolia. No data until 1981. Number of actual observations by date: 34.
Source name:
World Development Indicators
Source organization:
International Monetary Fund, Balance of Payments Statistics Yearbook and data files.
Categories, topics:
Economy & Growth, Trade
Last updated:
apr 23, 2017
Indicators value changes by year
Minimum:
14.021
jan 1, 1983
Maximum:
55.408
jan 1, 1998
At the date of observation
Value
Absolute change
Change from previous value
jan 1, 1982
26.542
+26.542
0.0%
jan 1, 1983
14.021
-12.521
-47.17%
jan 1, 1984
15.732
+1.712
12.21%
jan 1, 1985
19.582
+3.849
24.47%
jan 1, 1986
20.114
+0.532
2.72%
jan 1, 1987
24.466
+4.351
21.63%
jan 1, 1988
24.382
-0.084
-0.34%
jan 1, 1989
27.572
+3.19
13.08%
jan 1, 1990
53.022
+25.45
92.31%
jan 1, 1991
41.788
-11.234
-21.19%
jan 1, 1993
51.149
+9.361
22.4%
jan 1, 1994
53.846
+2.697
5.27%
jan 1, 1995
45.595
-8.251
-15.32%
jan 1, 1996
26.178
-19.417
-42.59%
jan 1, 1997
49.731
+23.553
89.97%
jan 1, 1998
55.408
+5.677
11.42%
jan 1, 1999
41.335
-14.073
-25.4%
jan 1, 2000
37.878
-3.457
-8.36%
jan 1, 2001
38.676
+0.798
2.11%
jan 1, 2002
31.552
-7.123
-18.42%
jan 1, 2003
21.02
-10.532
-33.38%
jan 1, 2004
19.502
-1.518
-7.22%
jan 1, 2005
31.814
+12.312
63.13%
jan 1, 2006
48.061
+16.247
51.07%
jan 1, 2007
44.125
-3.936
-8.19%
jan 1, 2008
38.052
-6.074
-13.76%
jan 1, 2009
31.809
-6.243
-16.41%
jan 1, 2010
32.607
+0.798
2.51%
jan 1, 2011
36.2
+3.593
11.02%
jan 1, 2012
40.344
+4.144
11.45%
jan 1, 2013
31.36
-8.984
-22.27%
jan 1, 2014
33.177
+1.817
5.8%
jan 1, 2015
33.574
+0.397
1.2%
jan 1, 2016
34.548
+0.974
2.9%
Ranking of countries by current statistics by years


Comments: