29
/
en
AIzaSyAYiBZKx7MnpbEhh9jyipgxe19OcubqV5w
April 1, 2024
246418
South Africa
ZAF
true
2
1
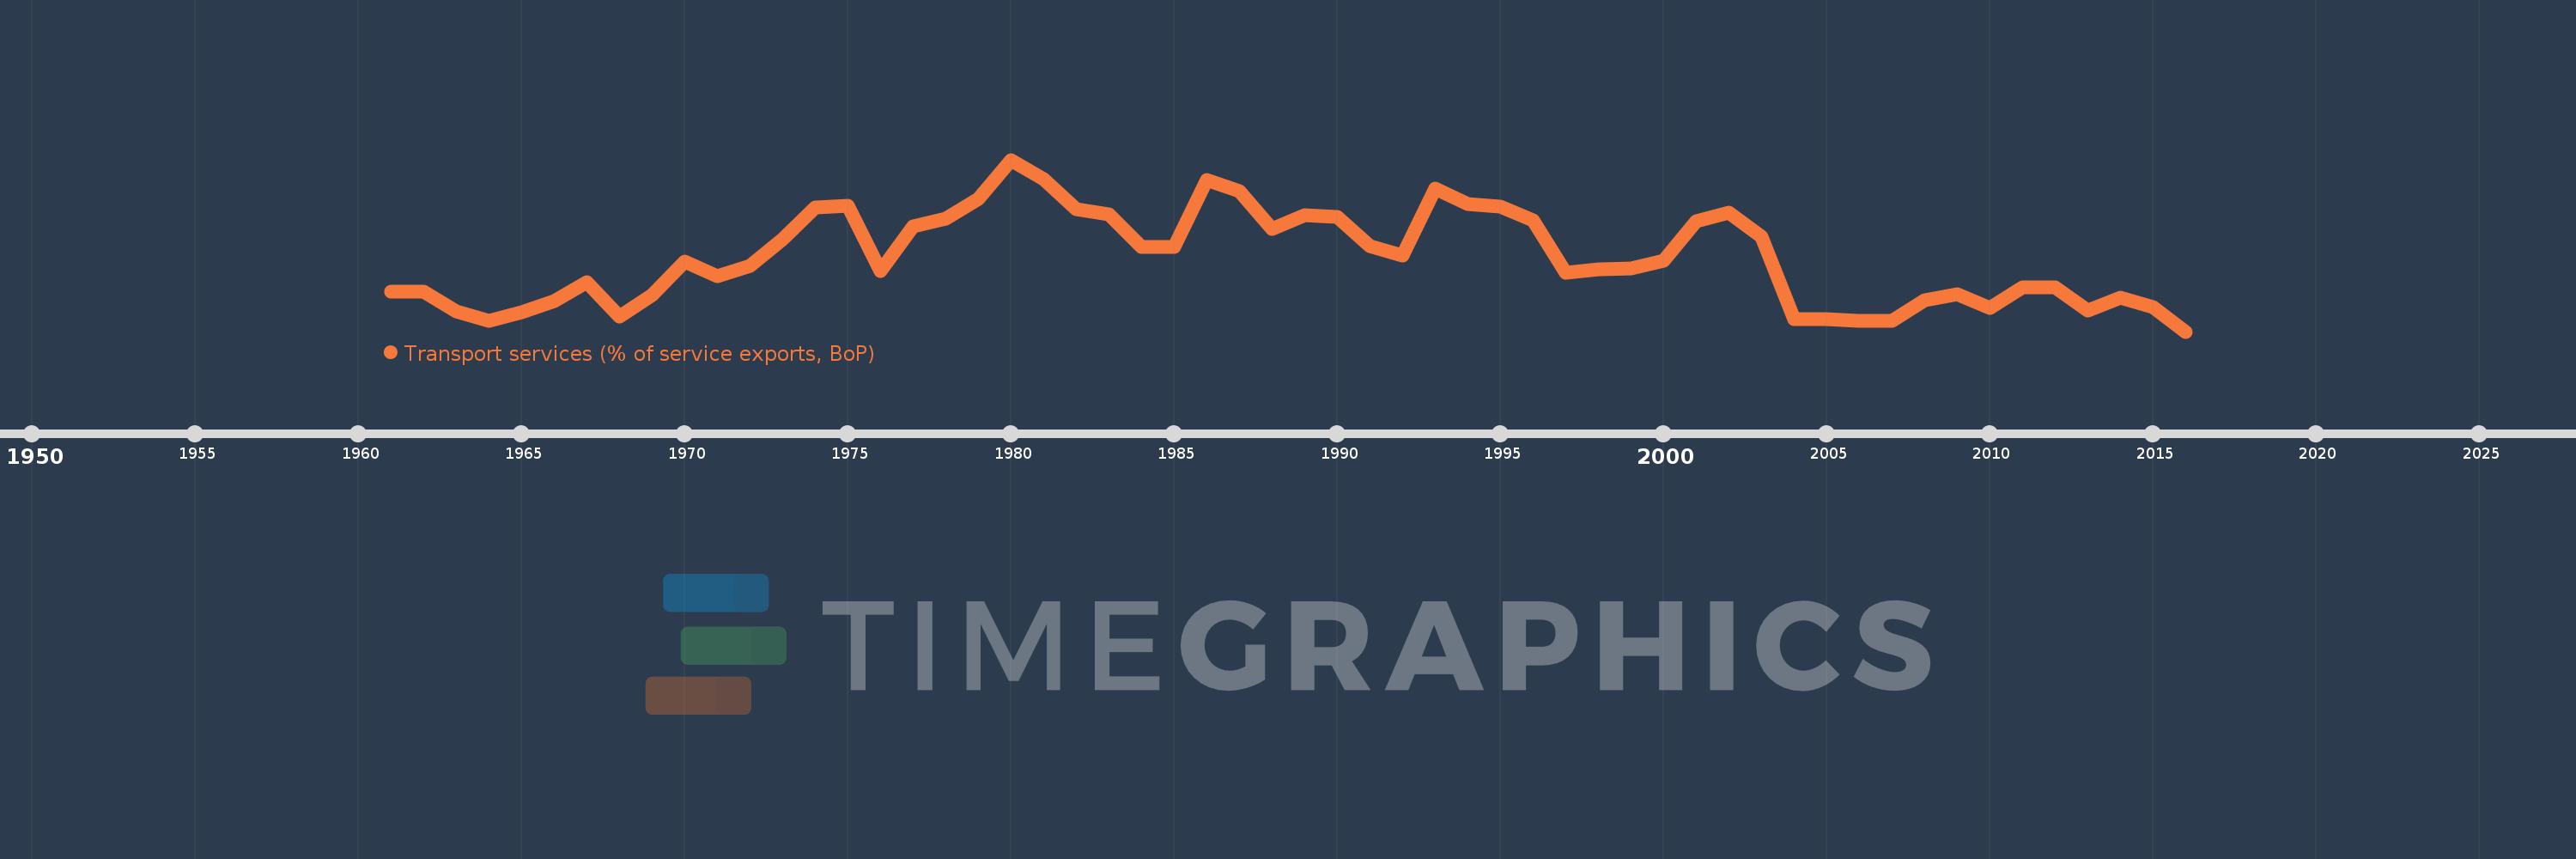
Transport services (% of service exports, BoP)
2016,2015,2014,2013,2012,2011,2010,2009,2008,2007,2006,2005,2004,2003,2002,2001,2000,1999,1998,1997,1996,1995,1994,1993,1992,1991,1990,1989,1988,1987,1986,1985,1984,1983,1982,1981,1980,1979,1978,1977,1976,1975,1974,1973,1972,1971,1970,1969,1968,1967,1966,1965,1964,1963,1962,1961
This statistics in other country:
AfghanistanAlbaniaAlgeriaAngolaAntigua and BarbudaArab WorldArgentinaArmeniaArubaAustraliaAustriaAzerbaijanBahamas, TheBahrainBangladeshBarbadosBelarusBelgiumBelizeBeninBermudaBhutanBoliviaBosnia and HerzegovinaBotswanaBrazilBrunei DarussalamBulgariaBurkina FasoBurundiCabo VerdeCambodiaCameroonCanadaCaribbean small statesCentral African RepublicCentral Europe and the BalticsChadChileChinaColombiaComorosCongo, Dem. Rep.Congo, Rep.Costa RicaCote d'IvoireCroatiaCuracaoCyprusCzech RepublicDenmarkDjiboutiDominicaDominican RepublicEarly-demographic dividendEast Asia & PacificEast Asia & Pacific (excluding high income)East Asia & Pacific (IDA & IBRD countries)EcuadorEgypt, Arab Rep.El SalvadorEritreaEstoniaEthiopiaEuro areaEurope & Central AsiaEurope & Central Asia (excluding high income)Europe & Central Asia (IDA & IBRD countries)European UnionFaroe IslandsFijiFinlandFragile and conflict affected situationsFranceFrench PolynesiaGabonGambia, TheGeorgiaGermanyGhanaGreeceGrenadaGuatemalaGuineaGuinea-BissauGuyanaHaitiHeavily indebted poor countries (HIPC)High incomeHondurasHong Kong SAR, ChinaHungaryIBRD onlyIcelandIDA & IBRD totalIDA onlyIDA totalIndiaIndonesiaIran, Islamic Rep.IraqIrelandIsraelItalyJamaicaJapanJordanKazakhstanKenyaKiribatiKorea, Rep.KosovoKuwaitKyrgyz RepublicLao PDRLate-demographic dividendLatin America & Caribbean Latin America & Caribbean (excluding high income)Latin America & the Caribbean (IDA & IBRD countries)LatviaLeast developed countries: UN classificationLebanonLesothoLiberiaLibyaLithuaniaLow & middle incomeLow incomeLower middle incomeLuxembourgMacao SAR, ChinaMacedonia, FYRMadagascarMalawiMalaysiaMaldivesMaliMaltaMarshall IslandsMauritaniaMauritiusMexicoMicronesia, Fed. Sts.Middle East & North AfricaMiddle East & North Africa (excluding high income)Middle East & North Africa (IDA & IBRD countries)Middle incomeMoldovaMongoliaMontenegroMoroccoMozambiqueMyanmarNamibiaNepalNetherlandsNew CaledoniaNew ZealandNicaraguaNigerNigeriaNorth AmericaNorwayOECD membersOmanOther small statesPacific island small statesPakistanPalauPanamaPapua New GuineaParaguayPeruPhilippinesPolandPortugalPost-demographic dividendPre-demographic dividendQatarRomaniaRussian FederationRwandaSamoaSao Tome and PrincipeSaudi ArabiaSenegalSerbiaSeychellesSierra LeoneSingaporeSint Maarten (Dutch part)Slovak RepublicSloveniaSmall statesSolomon IslandsSouth AfricaSouth AsiaSouth Asia (IDA & IBRD)South SudanSpainSri LankaSt. Kitts and NevisSt. LuciaSt. Vincent and the GrenadinesSub-Saharan Africa Sub-Saharan Africa (excluding high income)Sub-Saharan Africa (IDA & IBRD countries)SudanSurinameSwazilandSwedenSwitzerlandSyrian Arab RepublicTajikistanTanzaniaThailandTimor-LesteTogoTongaTrinidad and TobagoTunisiaTurkeyTuvaluUgandaUkraineUnited KingdomUnited StatesUpper middle incomeUruguayVanuatuVenezuela, RBWest Bank and GazaWorldYemen, Rep.ZambiaZimbabwe Timeline:
This timeline shows a graph from 1961 to 2016 of South Africa. No data until 1960. Number of actual observations by date: 56.
Source name:
World Development Indicators
Source organization:
International Monetary Fund, Balance of Payments Statistics Yearbook and data files.
Categories, topics:
Economy & Growth, Trade
Last updated:
apr 23, 2017
Indicators value changes by year
Maximum:
27.595
jan 1, 1980
At the date of observation
Value
Absolute change
Change from previous value
jan 1, 1961
18.994
+18.994
0.0%
jan 1, 1962
19.022
+0.027
0.14%
jan 1, 1963
17.708
-1.313
-6.9%
jan 1, 1964
17.13
-0.579
-3.27%
jan 1, 1965
17.647
+0.517
3.02%
jan 1, 1966
18.376
+0.729
4.13%
jan 1, 1967
19.63
+1.254
6.82%
jan 1, 1968
17.377
-2.253
-11.48%
jan 1, 1969
18.806
+1.429
8.22%
jan 1, 1970
20.994
+2.189
11.64%
jan 1, 1971
20.0
-0.994
-4.74%
jan 1, 1972
20.674
+0.674
3.37%
jan 1, 1973
22.398
+1.724
8.34%
jan 1, 1974
24.485
+2.087
9.32%
jan 1, 1975
24.594
+0.11
0.45%
jan 1, 1976
20.36
-4.235
-17.22%
jan 1, 1977
23.25
+2.89
14.19%
jan 1, 1978
23.744
+0.494
2.13%
jan 1, 1979
25.034
+1.29
5.43%
jan 1, 1980
27.595
+2.561
10.23%
jan 1, 1981
26.344
-1.251
-4.53%
jan 1, 1982
24.39
-1.954
-7.42%
jan 1, 1983
24.016
-0.374
-1.54%
jan 1, 1984
21.935
-2.081
-8.67%
jan 1, 1985
21.92
-0.014
-0.07%
jan 1, 1986
26.287
+4.367
19.92%
jan 1, 1987
25.536
-0.751
-2.86%
jan 1, 1988
23.103
-2.434
-9.53%
jan 1, 1989
23.985
+0.882
3.82%
jan 1, 1990
23.874
-0.111
-0.46%
jan 1, 1991
21.996
-1.878
-7.87%
jan 1, 1992
21.387
-0.609
-2.77%
jan 1, 1993
25.695
+4.308
20.14%
jan 1, 1994
24.692
-1.003
-3.9%
jan 1, 1995
24.555
-0.137
-0.56%
jan 1, 1996
23.666
-0.889
-3.62%
jan 1, 1997
20.26
-3.406
-14.39%
jan 1, 1998
20.484
+0.225
1.11%
jan 1, 1999
20.548
+0.064
0.31%
jan 1, 2000
21.038
+0.49
2.38%
jan 1, 2001
23.574
+2.536
12.06%
jan 1, 2002
24.139
+0.565
2.4%
jan 1, 2003
22.57
-1.569
-6.5%
jan 1, 2004
17.198
-5.373
-23.8%
jan 1, 2005
17.227
+0.029
0.17%
jan 1, 2006
17.083
-0.144
-0.84%
jan 1, 2007
17.114
+0.031
0.18%
jan 1, 2008
18.468
+1.354
7.91%
jan 1, 2009
18.837
+0.369
2.0%
jan 1, 2010
17.949
-0.888
-4.72%
jan 1, 2011
19.297
+1.349
7.51%
jan 1, 2012
19.263
-0.034
-0.18%
jan 1, 2013
17.783
-1.48
-7.68%
jan 1, 2014
18.625
+0.842
4.74%
jan 1, 2015
18.019
-0.606
-3.26%
jan 1, 2016
16.41
-1.609
-8.93%
Ranking of countries by current statistics by years


Comments: