29
/
en
AIzaSyAYiBZKx7MnpbEhh9jyipgxe19OcubqV5w
April 1, 2024
143671
Grenada
GRD
true
2
1
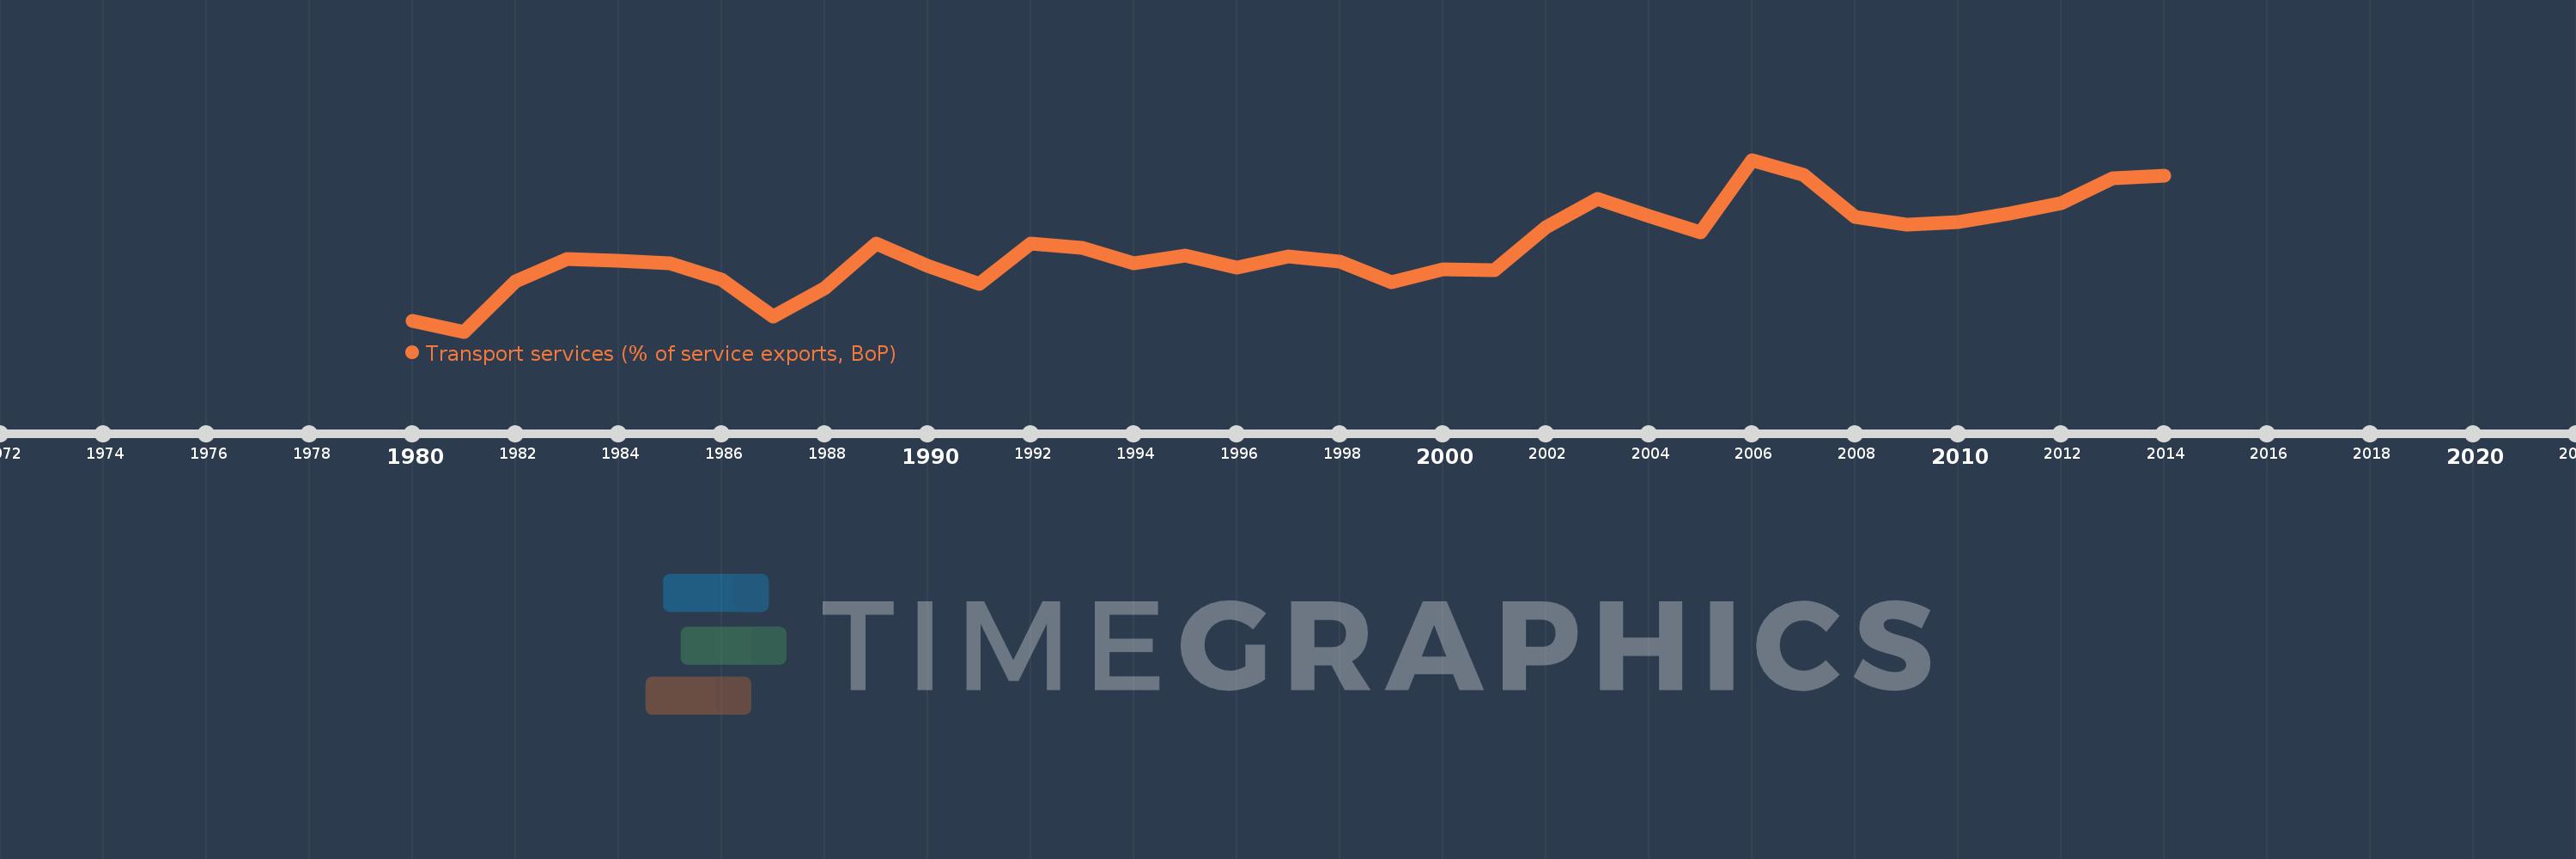
Transport services (% of service exports, BoP)
2014,2013,2012,2011,2010,2009,2008,2007,2006,2005,2004,2003,2002,2001,2000,1999,1998,1997,1996,1995,1994,1993,1992,1991,1990,1989,1988,1987,1986,1985,1984,1983,1982,1981,1980
This statistics in other country:
AfghanistanAlbaniaAlgeriaAngolaAntigua and BarbudaArab WorldArgentinaArmeniaArubaAustraliaAustriaAzerbaijanBahamas, TheBahrainBangladeshBarbadosBelarusBelgiumBelizeBeninBermudaBhutanBoliviaBosnia and HerzegovinaBotswanaBrazilBrunei DarussalamBulgariaBurkina FasoBurundiCabo VerdeCambodiaCameroonCanadaCaribbean small statesCentral African RepublicCentral Europe and the BalticsChadChileChinaColombiaComorosCongo, Dem. Rep.Congo, Rep.Costa RicaCote d'IvoireCroatiaCuracaoCyprusCzech RepublicDenmarkDjiboutiDominicaDominican RepublicEarly-demographic dividendEast Asia & PacificEast Asia & Pacific (excluding high income)East Asia & Pacific (IDA & IBRD countries)EcuadorEgypt, Arab Rep.El SalvadorEritreaEstoniaEthiopiaEuro areaEurope & Central AsiaEurope & Central Asia (excluding high income)Europe & Central Asia (IDA & IBRD countries)European UnionFaroe IslandsFijiFinlandFragile and conflict affected situationsFranceFrench PolynesiaGabonGambia, TheGeorgiaGermanyGhanaGreeceGrenadaGuatemalaGuineaGuinea-BissauGuyanaHaitiHeavily indebted poor countries (HIPC)High incomeHondurasHong Kong SAR, ChinaHungaryIBRD onlyIcelandIDA & IBRD totalIDA onlyIDA totalIndiaIndonesiaIran, Islamic Rep.IraqIrelandIsraelItalyJamaicaJapanJordanKazakhstanKenyaKiribatiKorea, Rep.KosovoKuwaitKyrgyz RepublicLao PDRLate-demographic dividendLatin America & Caribbean Latin America & Caribbean (excluding high income)Latin America & the Caribbean (IDA & IBRD countries)LatviaLeast developed countries: UN classificationLebanonLesothoLiberiaLibyaLithuaniaLow & middle incomeLow incomeLower middle incomeLuxembourgMacao SAR, ChinaMacedonia, FYRMadagascarMalawiMalaysiaMaldivesMaliMaltaMarshall IslandsMauritaniaMauritiusMexicoMicronesia, Fed. Sts.Middle East & North AfricaMiddle East & North Africa (excluding high income)Middle East & North Africa (IDA & IBRD countries)Middle incomeMoldovaMongoliaMontenegroMoroccoMozambiqueMyanmarNamibiaNepalNetherlandsNew CaledoniaNew ZealandNicaraguaNigerNigeriaNorth AmericaNorwayOECD membersOmanOther small statesPacific island small statesPakistanPalauPanamaPapua New GuineaParaguayPeruPhilippinesPolandPortugalPost-demographic dividendPre-demographic dividendQatarRomaniaRussian FederationRwandaSamoaSao Tome and PrincipeSaudi ArabiaSenegalSerbiaSeychellesSierra LeoneSingaporeSint Maarten (Dutch part)Slovak RepublicSloveniaSmall statesSolomon IslandsSouth AfricaSouth AsiaSouth Asia (IDA & IBRD)South SudanSpainSri LankaSt. Kitts and NevisSt. LuciaSt. Vincent and the GrenadinesSub-Saharan Africa Sub-Saharan Africa (excluding high income)Sub-Saharan Africa (IDA & IBRD countries)SudanSurinameSwazilandSwedenSwitzerlandSyrian Arab RepublicTajikistanTanzaniaThailandTimor-LesteTogoTongaTrinidad and TobagoTunisiaTurkeyTuvaluUgandaUkraineUnited KingdomUnited StatesUpper middle incomeUruguayVanuatuVenezuela, RBWest Bank and GazaWorldYemen, Rep.ZambiaZimbabwe Timeline:
This timeline shows a graph from 1980 to 2014 of Grenada. No data until 1979. Number of actual observations by date: 35.
Source name:
World Development Indicators
Source organization:
International Monetary Fund, Balance of Payments Statistics Yearbook and data files.
Categories, topics:
Economy & Growth, Trade
Last updated:
apr 23, 2017
Indicators value changes by year
At the date of observation
Value
Absolute change
Change from previous value
jan 1, 1980
1.044
+1.044
0.0%
jan 1, 1981
0.485
-0.559
-53.51%
jan 1, 1982
3.209
+2.723
560.96%
jan 1, 1983
4.372
+1.163
36.25%
jan 1, 1984
4.301
-0.071
-1.61%
jan 1, 1985
4.167
-0.134
-3.12%
jan 1, 1986
3.269
-0.898
-21.55%
jan 1, 1987
1.283
-1.986
-60.75%
jan 1, 1988
2.806
+1.523
118.69%
jan 1, 1989
5.241
+2.435
86.79%
jan 1, 1990
4.03
-1.211
-23.11%
jan 1, 1991
3.053
-0.977
-24.24%
jan 1, 1992
5.24
+2.187
71.64%
jan 1, 1993
5.011
-0.229
-4.37%
jan 1, 1994
4.177
-0.834
-16.64%
jan 1, 1995
4.575
+0.397
9.51%
jan 1, 1996
3.935
-0.639
-13.97%
jan 1, 1997
4.537
+0.602
15.29%
jan 1, 1998
4.268
-0.27
-5.94%
jan 1, 1999
3.16
-1.107
-25.94%
jan 1, 2000
3.84
+0.679
21.5%
jan 1, 2001
3.799
-0.041
-1.06%
jan 1, 2002
6.097
+2.298
60.48%
jan 1, 2003
7.627
+1.53
25.1%
jan 1, 2004
6.686
-0.94
-12.33%
jan 1, 2005
5.8
-0.887
-13.26%
jan 1, 2006
9.728
+3.928
67.73%
jan 1, 2007
8.916
-0.812
-8.35%
jan 1, 2008
6.677
-2.238
-25.11%
jan 1, 2009
6.221
-0.456
-6.83%
jan 1, 2010
6.39
+0.169
2.71%
jan 1, 2011
6.847
+0.458
7.16%
jan 1, 2012
7.381
+0.534
7.79%
jan 1, 2013
8.728
+1.347
18.25%
jan 1, 2014
8.858
+0.13
1.49%
Ranking of countries by current statistics by years


Comments: