29
/
en
AIzaSyAYiBZKx7MnpbEhh9jyipgxe19OcubqV5w
April 1, 2024
221679
Paraguay
PRY
true
2
1
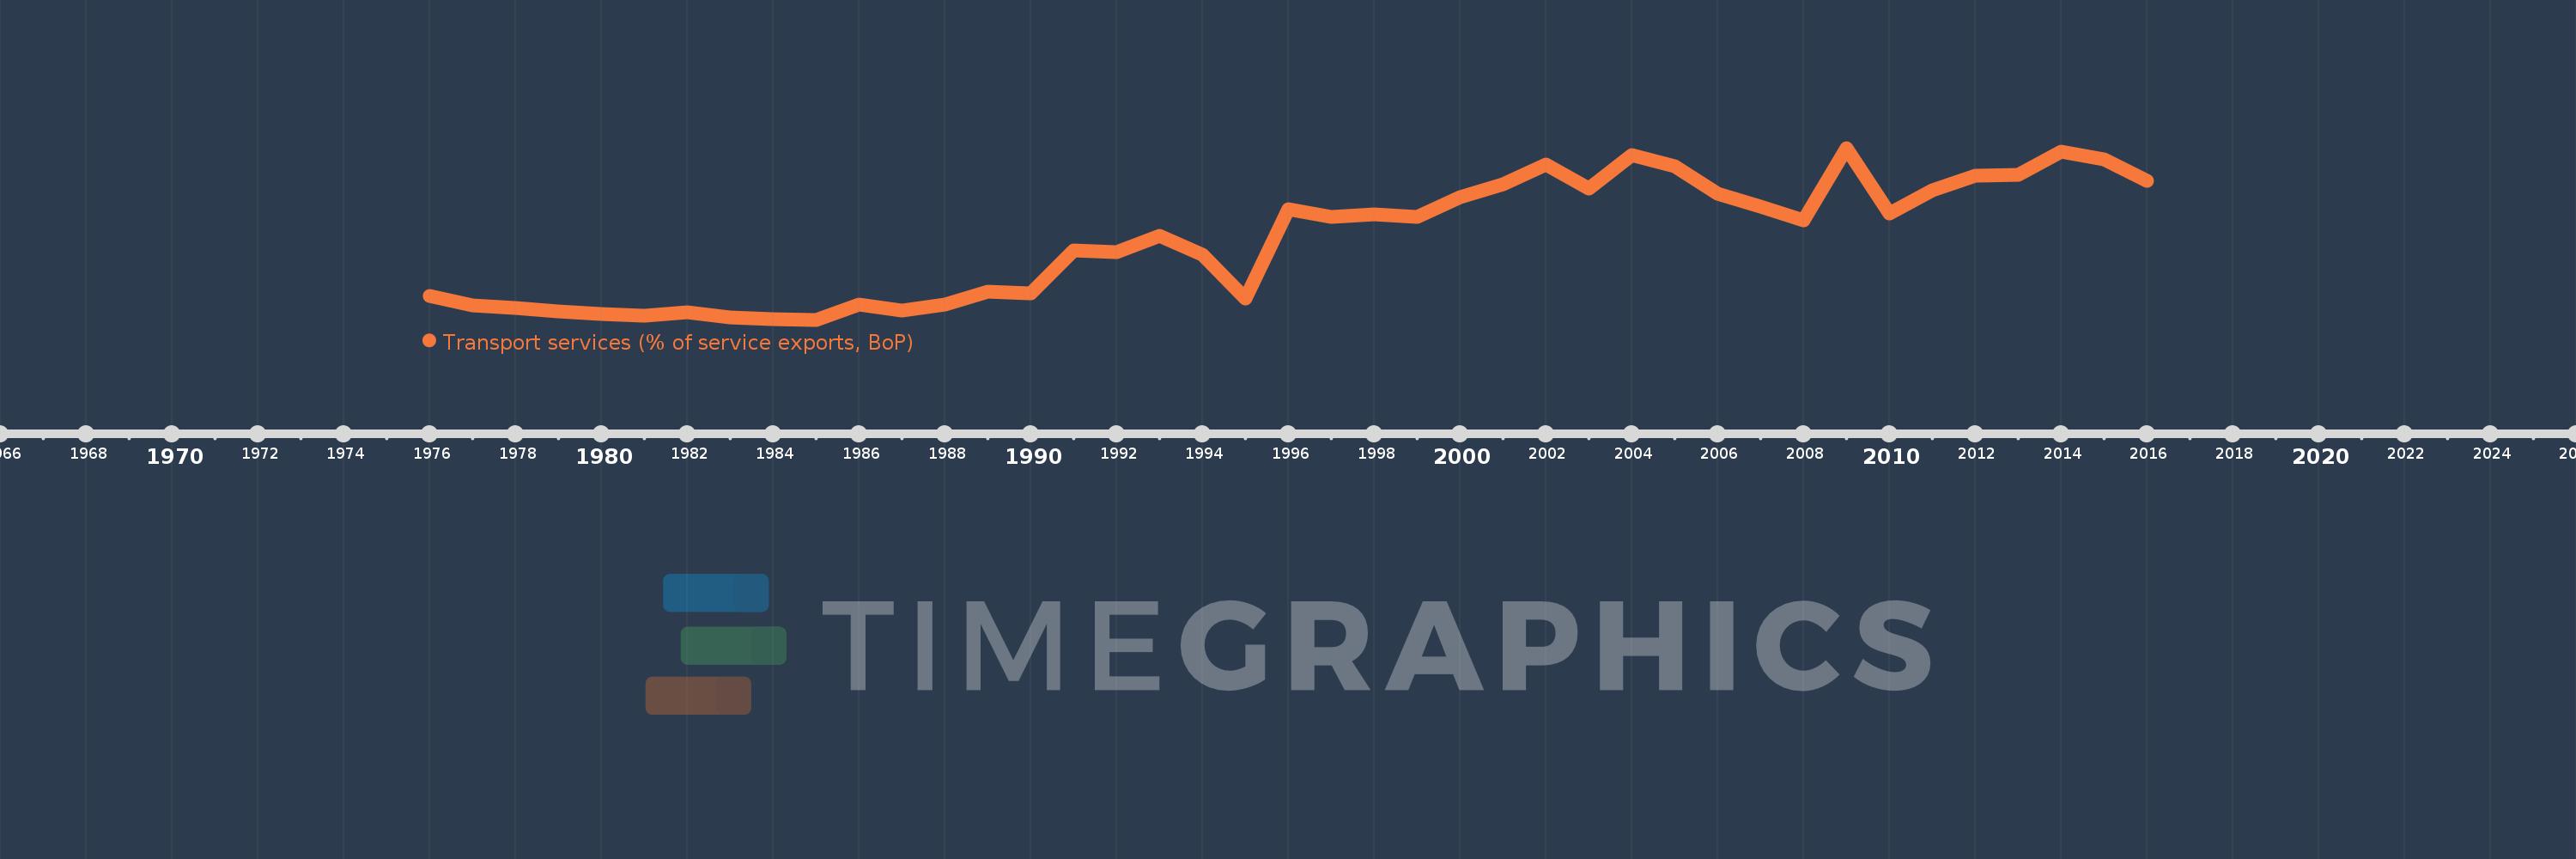
Transport services (% of service exports, BoP)
2016,2015,2014,2013,2012,2011,2010,2009,2008,2007,2006,2005,2004,2003,2002,2001,2000,1999,1998,1997,1996,1995,1994,1993,1992,1991,1990,1989,1988,1987,1986,1985,1984,1983,1982,1981,1980,1979,1978,1977,1976
This statistics in other country:
AfghanistanAlbaniaAlgeriaAngolaAntigua and BarbudaArab WorldArgentinaArmeniaArubaAustraliaAustriaAzerbaijanBahamas, TheBahrainBangladeshBarbadosBelarusBelgiumBelizeBeninBermudaBhutanBoliviaBosnia and HerzegovinaBotswanaBrazilBrunei DarussalamBulgariaBurkina FasoBurundiCabo VerdeCambodiaCameroonCanadaCaribbean small statesCentral African RepublicCentral Europe and the BalticsChadChileChinaColombiaComorosCongo, Dem. Rep.Congo, Rep.Costa RicaCote d'IvoireCroatiaCuracaoCyprusCzech RepublicDenmarkDjiboutiDominicaDominican RepublicEarly-demographic dividendEast Asia & PacificEast Asia & Pacific (excluding high income)East Asia & Pacific (IDA & IBRD countries)EcuadorEgypt, Arab Rep.El SalvadorEritreaEstoniaEthiopiaEuro areaEurope & Central AsiaEurope & Central Asia (excluding high income)Europe & Central Asia (IDA & IBRD countries)European UnionFaroe IslandsFijiFinlandFragile and conflict affected situationsFranceFrench PolynesiaGabonGambia, TheGeorgiaGermanyGhanaGreeceGrenadaGuatemalaGuineaGuinea-BissauGuyanaHaitiHeavily indebted poor countries (HIPC)High incomeHondurasHong Kong SAR, ChinaHungaryIBRD onlyIcelandIDA & IBRD totalIDA onlyIDA totalIndiaIndonesiaIran, Islamic Rep.IraqIrelandIsraelItalyJamaicaJapanJordanKazakhstanKenyaKiribatiKorea, Rep.KosovoKuwaitKyrgyz RepublicLao PDRLate-demographic dividendLatin America & Caribbean Latin America & Caribbean (excluding high income)Latin America & the Caribbean (IDA & IBRD countries)LatviaLeast developed countries: UN classificationLebanonLesothoLiberiaLibyaLithuaniaLow & middle incomeLow incomeLower middle incomeLuxembourgMacao SAR, ChinaMacedonia, FYRMadagascarMalawiMalaysiaMaldivesMaliMaltaMarshall IslandsMauritaniaMauritiusMexicoMicronesia, Fed. Sts.Middle East & North AfricaMiddle East & North Africa (excluding high income)Middle East & North Africa (IDA & IBRD countries)Middle incomeMoldovaMongoliaMontenegroMoroccoMozambiqueMyanmarNamibiaNepalNetherlandsNew CaledoniaNew ZealandNicaraguaNigerNigeriaNorth AmericaNorwayOECD membersOmanOther small statesPacific island small statesPakistanPalauPanamaPapua New GuineaParaguayPeruPhilippinesPolandPortugalPost-demographic dividendPre-demographic dividendQatarRomaniaRussian FederationRwandaSamoaSao Tome and PrincipeSaudi ArabiaSenegalSerbiaSeychellesSierra LeoneSingaporeSint Maarten (Dutch part)Slovak RepublicSloveniaSmall statesSolomon IslandsSouth AfricaSouth AsiaSouth Asia (IDA & IBRD)South SudanSpainSri LankaSt. Kitts and NevisSt. LuciaSt. Vincent and the GrenadinesSub-Saharan Africa Sub-Saharan Africa (excluding high income)Sub-Saharan Africa (IDA & IBRD countries)SudanSurinameSwazilandSwedenSwitzerlandSyrian Arab RepublicTajikistanTanzaniaThailandTimor-LesteTogoTongaTrinidad and TobagoTunisiaTurkeyTuvaluUgandaUkraineUnited KingdomUnited StatesUpper middle incomeUruguayVanuatuVenezuela, RBWest Bank and GazaWorldYemen, Rep.ZambiaZimbabwe Timeline:
This timeline shows a graph from 1976 to 2016 of Paraguay. No data until 1975. Number of actual observations by date: 41.
Source name:
World Development Indicators
Source organization:
International Monetary Fund, Balance of Payments Statistics Yearbook and data files.
Categories, topics:
Economy & Growth, Trade
Last updated:
apr 23, 2017
Indicators value changes by year
Maximum:
42.017
jan 1, 2009
At the date of observation
Value
Absolute change
Change from previous value
jan 1, 1976
6.745
+6.745
0.0%
jan 1, 1977
4.511
-2.234
-33.12%
jan 1, 1978
3.975
-0.537
-11.9%
jan 1, 1979
3.069
-0.906
-22.78%
jan 1, 1980
2.401
-0.668
-21.76%
jan 1, 1981
1.951
-0.45
-18.74%
jan 1, 1982
2.945
+0.994
50.93%
jan 1, 1983
1.744
-1.201
-40.77%
jan 1, 1984
1.232
-0.512
-29.37%
jan 1, 1985
1.091
-0.141
-11.43%
jan 1, 1986
4.781
+3.69
338.15%
jan 1, 1987
3.21
-1.571
-32.85%
jan 1, 1988
4.707
+1.497
46.62%
jan 1, 1989
7.84
+3.134
66.59%
jan 1, 1990
7.445
-0.396
-5.05%
jan 1, 1991
17.695
+10.25
137.68%
jan 1, 1992
17.217
-0.478
-2.7%
jan 1, 1993
20.982
+3.765
21.87%
jan 1, 1994
16.553
-4.429
-21.11%
jan 1, 1995
6.147
-10.405
-62.86%
jan 1, 1996
27.349
+21.202
344.89%
jan 1, 1997
25.558
-1.791
-6.55%
jan 1, 1998
26.301
+0.743
2.91%
jan 1, 1999
25.562
-0.739
-2.81%
jan 1, 2000
30.31
+4.749
18.58%
jan 1, 2001
33.422
+3.112
10.27%
jan 1, 2002
37.999
+4.577
13.69%
jan 1, 2003
32.41
-5.589
-14.71%
jan 1, 2004
40.395
+7.985
24.64%
jan 1, 2005
37.629
-2.766
-6.85%
jan 1, 2006
31.161
-6.468
-17.19%
jan 1, 2007
28.127
-3.034
-9.74%
jan 1, 2008
24.822
-3.305
-11.75%
jan 1, 2009
42.017
+17.196
69.28%
jan 1, 2010
26.475
-15.542
-36.99%
jan 1, 2011
32.009
+5.534
20.9%
jan 1, 2012
35.494
+3.485
10.89%
jan 1, 2013
35.547
+0.052
0.15%
jan 1, 2014
41.074
+5.528
15.55%
jan 1, 2015
39.321
-1.753
-4.27%
jan 1, 2016
34.15
-5.17
-13.15%
Ranking of countries by current statistics by years


Comments: