29
/
en
AIzaSyAYiBZKx7MnpbEhh9jyipgxe19OcubqV5w
April 1, 2024
43959
Latin America & the Caribbean (IDA & IBRD countries)
TLA
false
2
1
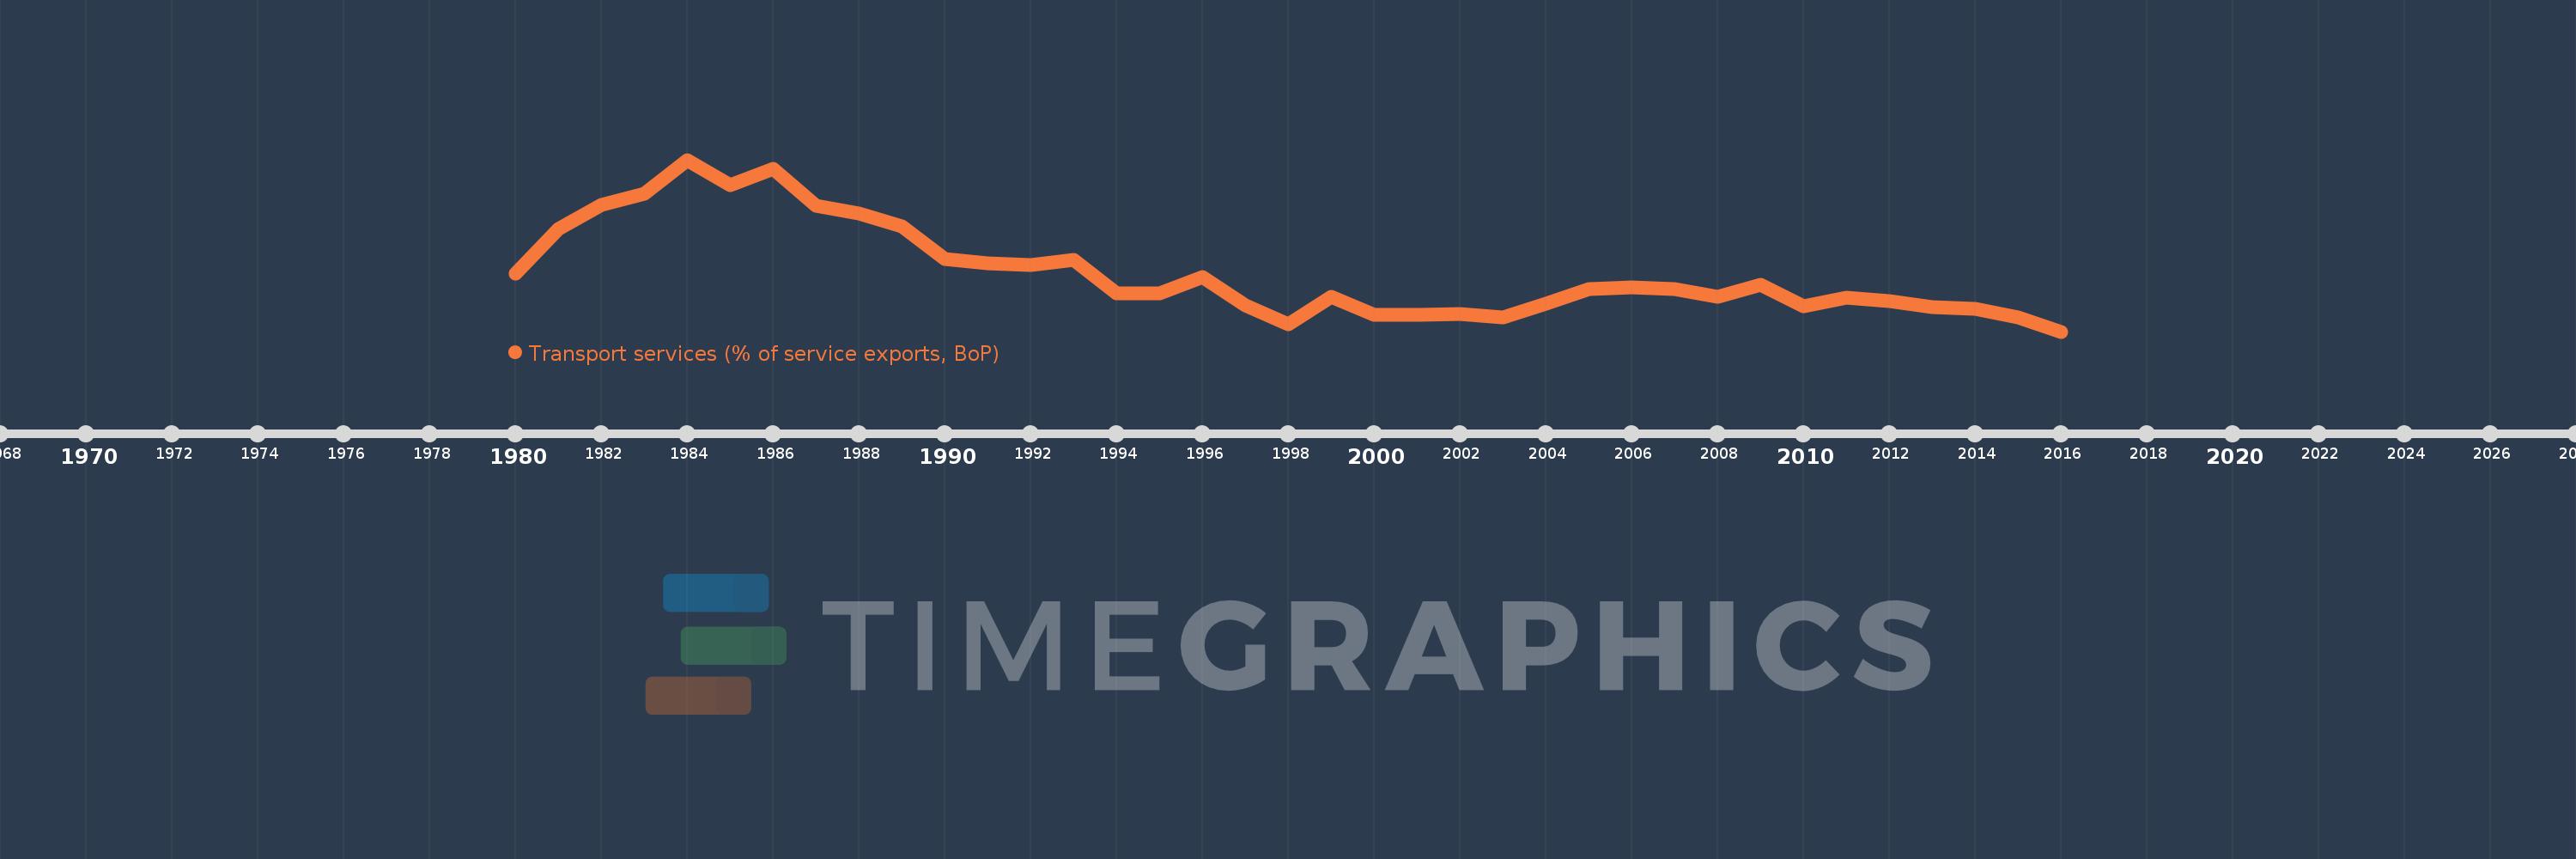
Transport services (% of service exports, BoP)
2016,2015,2014,2013,2012,2011,2010,2009,2008,2007,2006,2005,2004,2003,2002,2001,2000,1999,1998,1997,1996,1995,1994,1993,1992,1991,1990,1989,1988,1987,1986,1985,1984,1983,1982,1981,1980
This statistics in other country:
AfghanistanAlbaniaAlgeriaAngolaAntigua and BarbudaArab WorldArgentinaArmeniaArubaAustraliaAustriaAzerbaijanBahamas, TheBahrainBangladeshBarbadosBelarusBelgiumBelizeBeninBermudaBhutanBoliviaBosnia and HerzegovinaBotswanaBrazilBrunei DarussalamBulgariaBurkina FasoBurundiCabo VerdeCambodiaCameroonCanadaCaribbean small statesCentral African RepublicCentral Europe and the BalticsChadChileChinaColombiaComorosCongo, Dem. Rep.Congo, Rep.Costa RicaCote d'IvoireCroatiaCuracaoCyprusCzech RepublicDenmarkDjiboutiDominicaDominican RepublicEarly-demographic dividendEast Asia & PacificEast Asia & Pacific (excluding high income)East Asia & Pacific (IDA & IBRD countries)EcuadorEgypt, Arab Rep.El SalvadorEritreaEstoniaEthiopiaEuro areaEurope & Central AsiaEurope & Central Asia (excluding high income)Europe & Central Asia (IDA & IBRD countries)European UnionFaroe IslandsFijiFinlandFragile and conflict affected situationsFranceFrench PolynesiaGabonGambia, TheGeorgiaGermanyGhanaGreeceGrenadaGuatemalaGuineaGuinea-BissauGuyanaHaitiHeavily indebted poor countries (HIPC)High incomeHondurasHong Kong SAR, ChinaHungaryIBRD onlyIcelandIDA & IBRD totalIDA onlyIDA totalIndiaIndonesiaIran, Islamic Rep.IraqIrelandIsraelItalyJamaicaJapanJordanKazakhstanKenyaKiribatiKorea, Rep.KosovoKuwaitKyrgyz RepublicLao PDRLate-demographic dividendLatin America & Caribbean Latin America & Caribbean (excluding high income)Latin America & the Caribbean (IDA & IBRD countries)LatviaLeast developed countries: UN classificationLebanonLesothoLiberiaLibyaLithuaniaLow & middle incomeLow incomeLower middle incomeLuxembourgMacao SAR, ChinaMacedonia, FYRMadagascarMalawiMalaysiaMaldivesMaliMaltaMarshall IslandsMauritaniaMauritiusMexicoMicronesia, Fed. Sts.Middle East & North AfricaMiddle East & North Africa (excluding high income)Middle East & North Africa (IDA & IBRD countries)Middle incomeMoldovaMongoliaMontenegroMoroccoMozambiqueMyanmarNamibiaNepalNetherlandsNew CaledoniaNew ZealandNicaraguaNigerNigeriaNorth AmericaNorwayOECD membersOmanOther small statesPacific island small statesPakistanPalauPanamaPapua New GuineaParaguayPeruPhilippinesPolandPortugalPost-demographic dividendPre-demographic dividendQatarRomaniaRussian FederationRwandaSamoaSao Tome and PrincipeSaudi ArabiaSenegalSerbiaSeychellesSierra LeoneSingaporeSint Maarten (Dutch part)Slovak RepublicSloveniaSmall statesSolomon IslandsSouth AfricaSouth AsiaSouth Asia (IDA & IBRD)South SudanSpainSri LankaSt. Kitts and NevisSt. LuciaSt. Vincent and the GrenadinesSub-Saharan Africa Sub-Saharan Africa (excluding high income)Sub-Saharan Africa (IDA & IBRD countries)SudanSurinameSwazilandSwedenSwitzerlandSyrian Arab RepublicTajikistanTanzaniaThailandTimor-LesteTogoTongaTrinidad and TobagoTunisiaTurkeyTuvaluUgandaUkraineUnited KingdomUnited StatesUpper middle incomeUruguayVanuatuVenezuela, RBWest Bank and GazaWorldYemen, Rep.ZambiaZimbabwe Timeline:
This timeline shows a graph from 1980 to 2016 of Latin America & the Caribbean (IDA & IBRD countries). No data until 1979. Number of actual observations by date: 37.
Source name:
World Development Indicators
Source organization:
International Monetary Fund, Balance of Payments Statistics Yearbook and data files.
Categories, topics:
Economy & Growth, Trade
Last updated:
apr 23, 2017
Indicators value changes by year
Minimum:
17.601
jan 1, 2016
Maximum:
32.531
jan 1, 1984
At the date of observation
Value
Absolute change
Change from previous value
jan 1, 1980
22.664
+22.664
0.0%
jan 1, 1981
26.542
+3.878
17.11%
jan 1, 1982
28.586
+2.044
7.7%
jan 1, 1983
29.579
+0.992
3.47%
jan 1, 1984
32.531
+2.952
9.98%
jan 1, 1985
30.294
-2.237
-6.88%
jan 1, 1986
31.753
+1.459
4.82%
jan 1, 1987
28.532
-3.221
-10.14%
jan 1, 1988
27.886
-0.646
-2.27%
jan 1, 1989
26.749
-1.137
-4.08%
jan 1, 1990
23.873
-2.876
-10.75%
jan 1, 1991
23.555
-0.318
-1.33%
jan 1, 1992
23.422
-0.132
-0.56%
jan 1, 1993
23.85
+0.428
1.83%
jan 1, 1994
20.919
-2.931
-12.29%
jan 1, 1995
20.929
+0.01
0.05%
jan 1, 1996
22.329
+1.4
6.69%
jan 1, 1997
19.895
-2.434
-10.9%
jan 1, 1998
18.207
-1.688
-8.48%
jan 1, 1999
20.659
+2.452
13.47%
jan 1, 2000
19.072
-1.587
-7.68%
jan 1, 2001
19.055
-0.017
-0.09%
jan 1, 2002
19.156
+0.102
0.53%
jan 1, 2003
18.86
-0.297
-1.55%
jan 1, 2004
20.026
+1.167
6.19%
jan 1, 2005
21.28
+1.254
6.26%
jan 1, 2006
21.474
+0.194
0.91%
jan 1, 2007
21.316
-0.158
-0.74%
jan 1, 2008
20.621
-0.695
-3.26%
jan 1, 2009
21.636
+1.015
4.92%
jan 1, 2010
19.799
-1.837
-8.49%
jan 1, 2011
20.564
+0.764
3.86%
jan 1, 2012
20.272
-0.291
-1.42%
jan 1, 2013
19.753
-0.519
-2.56%
jan 1, 2014
19.576
-0.177
-0.9%
jan 1, 2015
18.805
-0.771
-3.94%
jan 1, 2016
17.601
-1.204
-6.4%
Ranking of countries by current statistics by years


Comments: