29
/
en
AIzaSyAYiBZKx7MnpbEhh9jyipgxe19OcubqV5w
April 1, 2024
31207
Europe & Central Asia
ECS
false
2
1
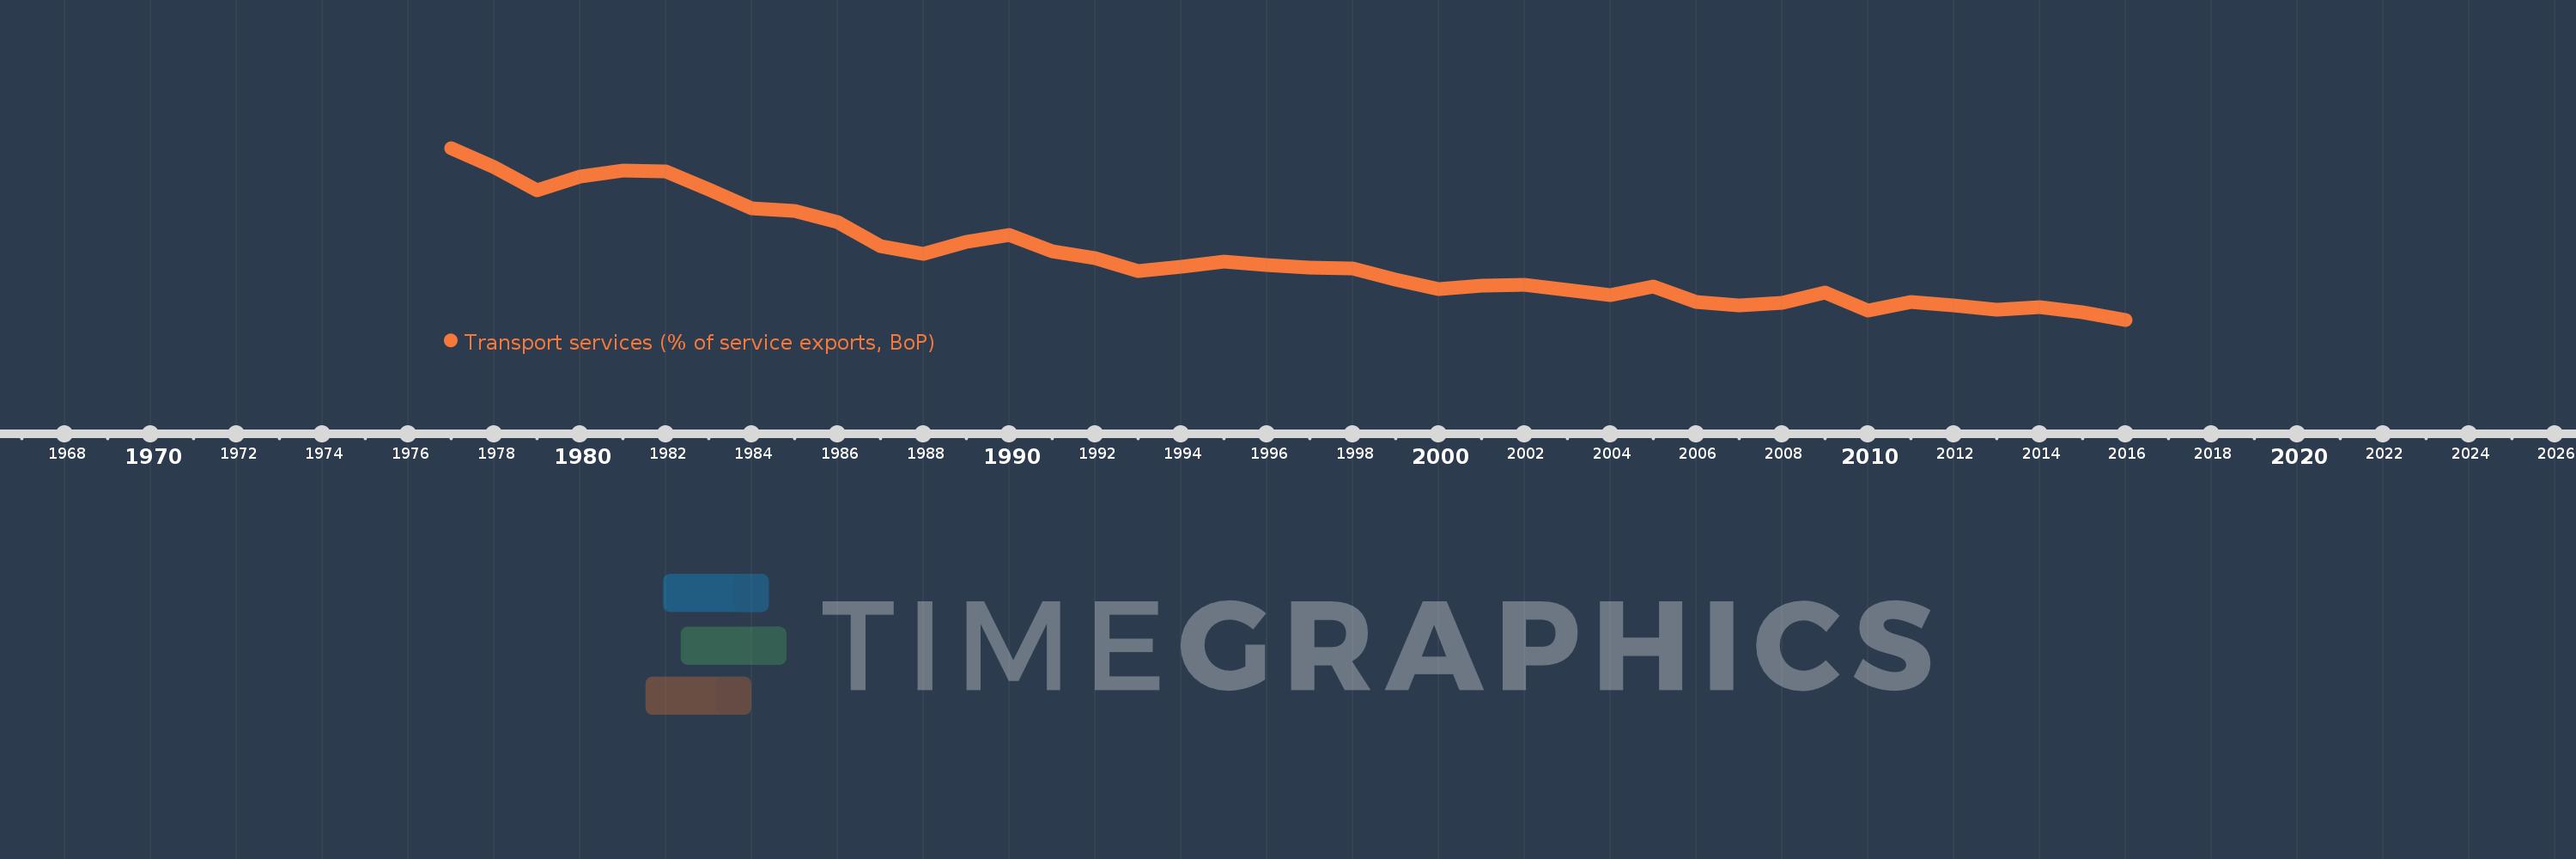
Transport services (% of service exports, BoP)
2016,2015,2014,2013,2012,2011,2010,2009,2008,2007,2006,2005,2004,2003,2002,2001,2000,1999,1998,1997,1996,1995,1994,1993,1992,1991,1990,1989,1988,1987,1986,1985,1984,1983,1982,1981,1980,1979,1978,1977
This statistics in other country:
AfghanistanAlbaniaAlgeriaAngolaAntigua and BarbudaArab WorldArgentinaArmeniaArubaAustraliaAustriaAzerbaijanBahamas, TheBahrainBangladeshBarbadosBelarusBelgiumBelizeBeninBermudaBhutanBoliviaBosnia and HerzegovinaBotswanaBrazilBrunei DarussalamBulgariaBurkina FasoBurundiCabo VerdeCambodiaCameroonCanadaCaribbean small statesCentral African RepublicCentral Europe and the BalticsChadChileChinaColombiaComorosCongo, Dem. Rep.Congo, Rep.Costa RicaCote d'IvoireCroatiaCuracaoCyprusCzech RepublicDenmarkDjiboutiDominicaDominican RepublicEarly-demographic dividendEast Asia & PacificEast Asia & Pacific (excluding high income)East Asia & Pacific (IDA & IBRD countries)EcuadorEgypt, Arab Rep.El SalvadorEritreaEstoniaEthiopiaEuro areaEurope & Central AsiaEurope & Central Asia (excluding high income)Europe & Central Asia (IDA & IBRD countries)European UnionFaroe IslandsFijiFinlandFragile and conflict affected situationsFranceFrench PolynesiaGabonGambia, TheGeorgiaGermanyGhanaGreeceGrenadaGuatemalaGuineaGuinea-BissauGuyanaHaitiHeavily indebted poor countries (HIPC)High incomeHondurasHong Kong SAR, ChinaHungaryIBRD onlyIcelandIDA & IBRD totalIDA onlyIDA totalIndiaIndonesiaIran, Islamic Rep.IraqIrelandIsraelItalyJamaicaJapanJordanKazakhstanKenyaKiribatiKorea, Rep.KosovoKuwaitKyrgyz RepublicLao PDRLate-demographic dividendLatin America & Caribbean Latin America & Caribbean (excluding high income)Latin America & the Caribbean (IDA & IBRD countries)LatviaLeast developed countries: UN classificationLebanonLesothoLiberiaLibyaLithuaniaLow & middle incomeLow incomeLower middle incomeLuxembourgMacao SAR, ChinaMacedonia, FYRMadagascarMalawiMalaysiaMaldivesMaliMaltaMarshall IslandsMauritaniaMauritiusMexicoMicronesia, Fed. Sts.Middle East & North AfricaMiddle East & North Africa (excluding high income)Middle East & North Africa (IDA & IBRD countries)Middle incomeMoldovaMongoliaMontenegroMoroccoMozambiqueMyanmarNamibiaNepalNetherlandsNew CaledoniaNew ZealandNicaraguaNigerNigeriaNorth AmericaNorwayOECD membersOmanOther small statesPacific island small statesPakistanPalauPanamaPapua New GuineaParaguayPeruPhilippinesPolandPortugalPost-demographic dividendPre-demographic dividendQatarRomaniaRussian FederationRwandaSamoaSao Tome and PrincipeSaudi ArabiaSenegalSerbiaSeychellesSierra LeoneSingaporeSint Maarten (Dutch part)Slovak RepublicSloveniaSmall statesSolomon IslandsSouth AfricaSouth AsiaSouth Asia (IDA & IBRD)South SudanSpainSri LankaSt. Kitts and NevisSt. LuciaSt. Vincent and the GrenadinesSub-Saharan Africa Sub-Saharan Africa (excluding high income)Sub-Saharan Africa (IDA & IBRD countries)SudanSurinameSwazilandSwedenSwitzerlandSyrian Arab RepublicTajikistanTanzaniaThailandTimor-LesteTogoTongaTrinidad and TobagoTunisiaTurkeyTuvaluUgandaUkraineUnited KingdomUnited StatesUpper middle incomeUruguayVanuatuVenezuela, RBWest Bank and GazaWorldYemen, Rep.ZambiaZimbabwe Timeline:
This timeline shows a graph from 1977 to 2016 of Europe & Central Asia. No data until 1976. Number of actual observations by date: 40.
Source name:
World Development Indicators
Source organization:
International Monetary Fund, Balance of Payments Statistics Yearbook and data files.
Categories, topics:
Economy & Growth, Trade
Last updated:
apr 23, 2017
Indicators value changes by year
Minimum:
18.649
jan 1, 2016
Maximum:
36.617
jan 1, 1977
At the date of observation
Value
Absolute change
Change from previous value
jan 1, 1977
36.617
+36.617
0.0%
jan 1, 1978
34.635
-1.982
-5.41%
jan 1, 1979
32.174
-2.46
-7.1%
jan 1, 1980
33.662
+1.488
4.62%
jan 1, 1981
34.216
+0.554
1.65%
jan 1, 1982
34.196
-0.02
-0.06%
jan 1, 1983
32.322
-1.875
-5.48%
jan 1, 1984
30.315
-2.007
-6.21%
jan 1, 1985
30.045
-0.27
-0.89%
jan 1, 1986
28.857
-1.188
-3.95%
jan 1, 1987
26.333
-2.525
-8.75%
jan 1, 1988
25.516
-0.817
-3.1%
jan 1, 1989
26.766
+1.251
4.9%
jan 1, 1990
27.525
+0.758
2.83%
jan 1, 1991
25.854
-1.671
-6.07%
jan 1, 1992
25.057
-0.797
-3.08%
jan 1, 1993
23.706
-1.351
-5.39%
jan 1, 1994
24.167
+0.461
1.94%
jan 1, 1995
24.76
+0.594
2.46%
jan 1, 1996
24.354
-0.406
-1.64%
jan 1, 1997
24.066
-0.288
-1.18%
jan 1, 1998
24.022
-0.045
-0.19%
jan 1, 1999
22.83
-1.192
-4.96%
jan 1, 2000
21.884
-0.946
-4.14%
jan 1, 2001
22.199
+0.315
1.44%
jan 1, 2002
22.304
+0.105
0.47%
jan 1, 2003
21.728
-0.576
-2.58%
jan 1, 2004
21.198
-0.53
-2.44%
jan 1, 2005
22.151
+0.953
4.5%
jan 1, 2006
20.526
-1.626
-7.34%
jan 1, 2007
20.106
-0.42
-2.04%
jan 1, 2008
20.41
+0.304
1.51%
jan 1, 2009
21.466
+1.056
5.17%
jan 1, 2010
19.571
-1.895
-8.83%
jan 1, 2011
20.515
+0.944
4.82%
jan 1, 2012
20.17
-0.345
-1.68%
jan 1, 2013
19.73
-0.441
-2.19%
jan 1, 2014
19.953
+0.223
1.13%
jan 1, 2015
19.389
-0.564
-2.83%
jan 1, 2016
18.649
-0.74
-3.81%
Ranking of countries by current statistics by years


Comments: