29
/
en
AIzaSyAYiBZKx7MnpbEhh9jyipgxe19OcubqV5w
April 1, 2024
266431
Tonga
TON
true
2
1
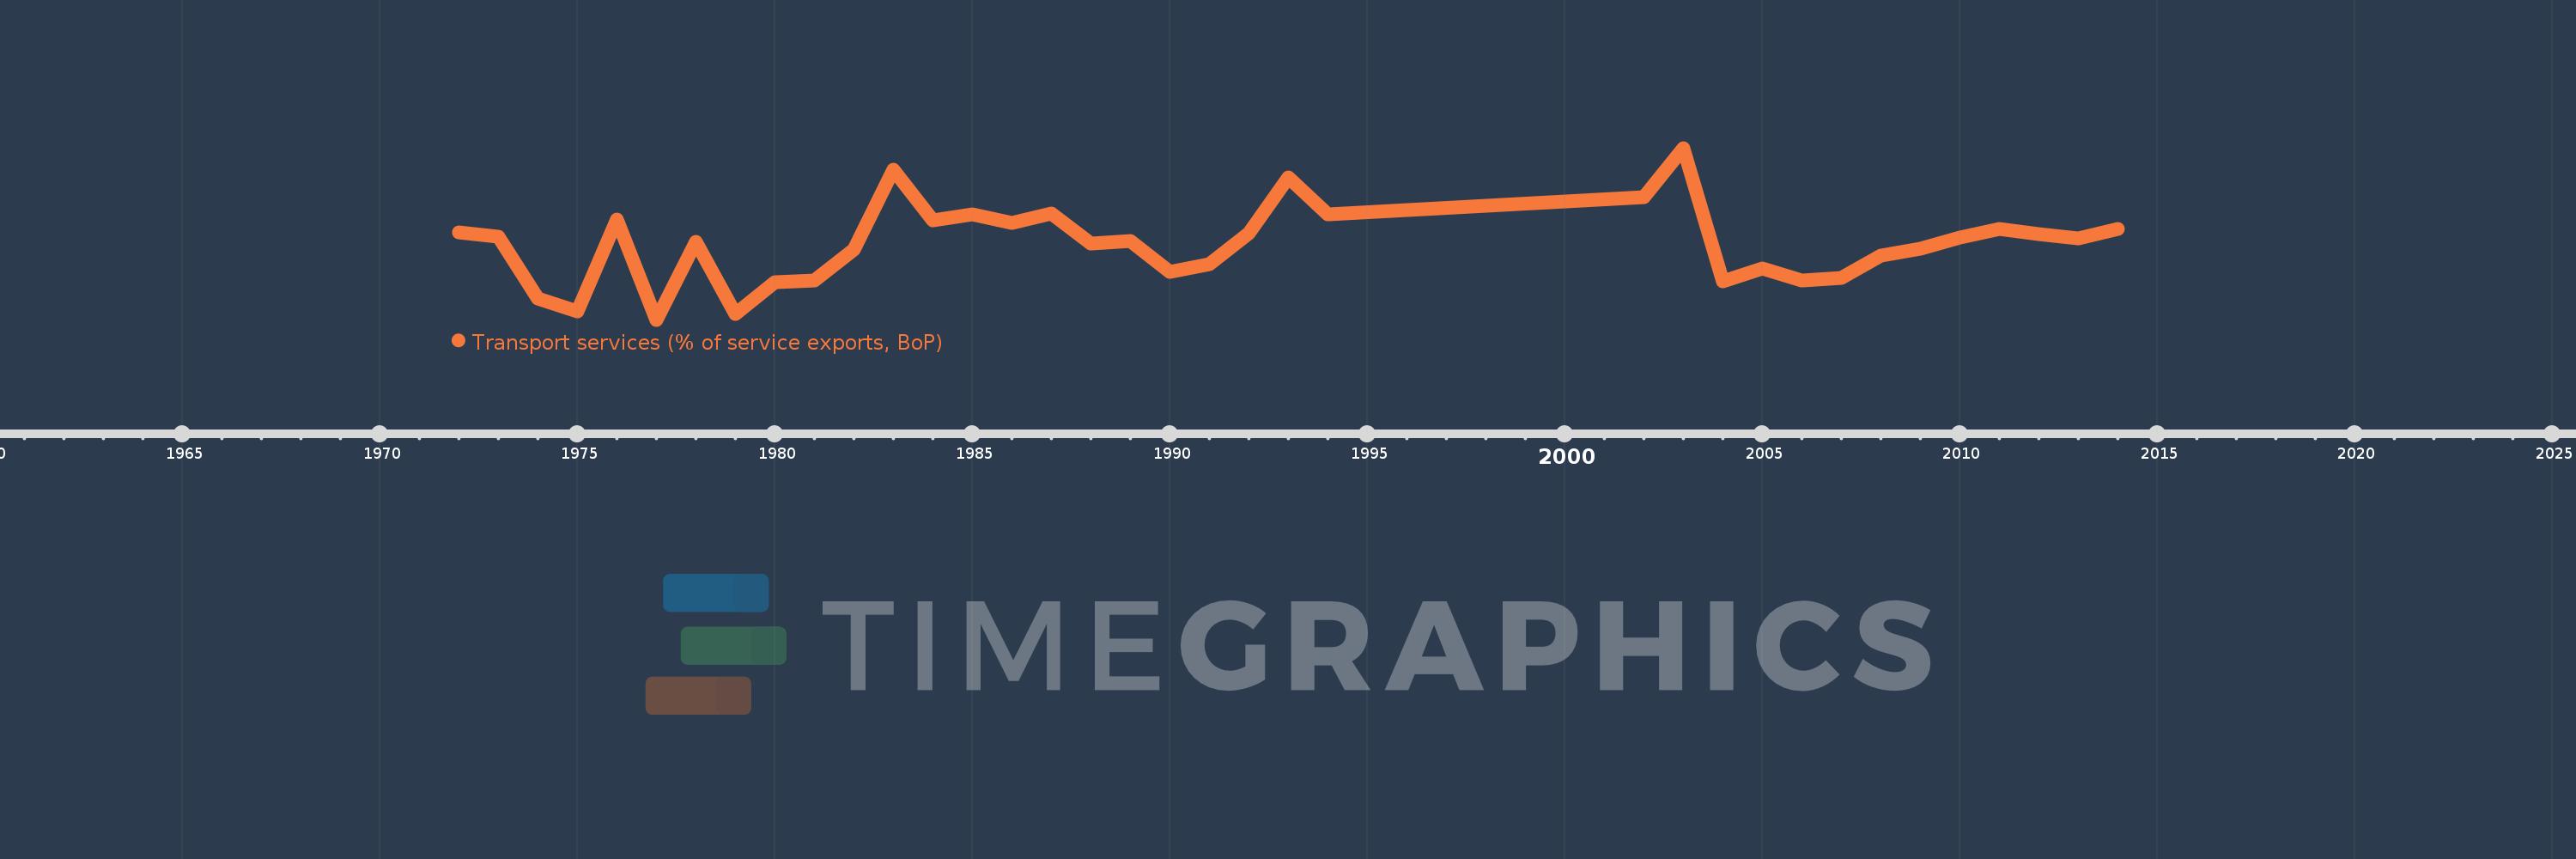
Transport services (% of service exports, BoP)
2014,2013,2012,2011,2010,2009,2008,2007,2006,2005,2004,2003,2002,1994,1993,1992,1991,1990,1989,1988,1987,1986,1985,1984,1983,1982,1981,1980,1979,1978,1977,1976,1975,1974,1973,1972
This statistics in other country:
AfghanistanAlbaniaAlgeriaAngolaAntigua and BarbudaArab WorldArgentinaArmeniaArubaAustraliaAustriaAzerbaijanBahamas, TheBahrainBangladeshBarbadosBelarusBelgiumBelizeBeninBermudaBhutanBoliviaBosnia and HerzegovinaBotswanaBrazilBrunei DarussalamBulgariaBurkina FasoBurundiCabo VerdeCambodiaCameroonCanadaCaribbean small statesCentral African RepublicCentral Europe and the BalticsChadChileChinaColombiaComorosCongo, Dem. Rep.Congo, Rep.Costa RicaCote d'IvoireCroatiaCuracaoCyprusCzech RepublicDenmarkDjiboutiDominicaDominican RepublicEarly-demographic dividendEast Asia & PacificEast Asia & Pacific (excluding high income)East Asia & Pacific (IDA & IBRD countries)EcuadorEgypt, Arab Rep.El SalvadorEritreaEstoniaEthiopiaEuro areaEurope & Central AsiaEurope & Central Asia (excluding high income)Europe & Central Asia (IDA & IBRD countries)European UnionFaroe IslandsFijiFinlandFragile and conflict affected situationsFranceFrench PolynesiaGabonGambia, TheGeorgiaGermanyGhanaGreeceGrenadaGuatemalaGuineaGuinea-BissauGuyanaHaitiHeavily indebted poor countries (HIPC)High incomeHondurasHong Kong SAR, ChinaHungaryIBRD onlyIcelandIDA & IBRD totalIDA onlyIDA totalIndiaIndonesiaIran, Islamic Rep.IraqIrelandIsraelItalyJamaicaJapanJordanKazakhstanKenyaKiribatiKorea, Rep.KosovoKuwaitKyrgyz RepublicLao PDRLate-demographic dividendLatin America & Caribbean Latin America & Caribbean (excluding high income)Latin America & the Caribbean (IDA & IBRD countries)LatviaLeast developed countries: UN classificationLebanonLesothoLiberiaLibyaLithuaniaLow & middle incomeLow incomeLower middle incomeLuxembourgMacao SAR, ChinaMacedonia, FYRMadagascarMalawiMalaysiaMaldivesMaliMaltaMarshall IslandsMauritaniaMauritiusMexicoMicronesia, Fed. Sts.Middle East & North AfricaMiddle East & North Africa (excluding high income)Middle East & North Africa (IDA & IBRD countries)Middle incomeMoldovaMongoliaMontenegroMoroccoMozambiqueMyanmarNamibiaNepalNetherlandsNew CaledoniaNew ZealandNicaraguaNigerNigeriaNorth AmericaNorwayOECD membersOmanOther small statesPacific island small statesPakistanPalauPanamaPapua New GuineaParaguayPeruPhilippinesPolandPortugalPost-demographic dividendPre-demographic dividendQatarRomaniaRussian FederationRwandaSamoaSao Tome and PrincipeSaudi ArabiaSenegalSerbiaSeychellesSierra LeoneSingaporeSint Maarten (Dutch part)Slovak RepublicSloveniaSmall statesSolomon IslandsSouth AfricaSouth AsiaSouth Asia (IDA & IBRD)South SudanSpainSri LankaSt. Kitts and NevisSt. LuciaSt. Vincent and the GrenadinesSub-Saharan Africa Sub-Saharan Africa (excluding high income)Sub-Saharan Africa (IDA & IBRD countries)SudanSurinameSwazilandSwedenSwitzerlandSyrian Arab RepublicTajikistanTanzaniaThailandTimor-LesteTogoTongaTrinidad and TobagoTunisiaTurkeyTuvaluUgandaUkraineUnited KingdomUnited StatesUpper middle incomeUruguayVanuatuVenezuela, RBWest Bank and GazaWorldYemen, Rep.ZambiaZimbabwe Timeline:
This timeline shows a graph from 1972 to 2014 of Tonga. No data until 1971. Number of actual observations by date: 36.
Source name:
World Development Indicators
Source organization:
International Monetary Fund, Balance of Payments Statistics Yearbook and data files.
Categories, topics:
Economy & Growth, Trade
Last updated:
apr 23, 2017
Indicators value changes by year
Maximum:
28.067
jan 1, 2003
At the date of observation
Value
Absolute change
Change from previous value
jan 1, 1972
16.204
+16.204
0.0%
jan 1, 1973
15.593
-0.611
-3.77%
jan 1, 1974
6.849
-8.744
-56.08%
jan 1, 1975
5.025
-1.824
-26.64%
jan 1, 1976
17.992
+12.968
258.06%
jan 1, 1977
3.88
-14.112
-78.43%
jan 1, 1978
14.876
+10.996
283.36%
jan 1, 1979
4.686
-10.19
-68.5%
jan 1, 1980
9.211
+4.524
96.55%
jan 1, 1981
9.394
+0.183
1.99%
jan 1, 1982
13.785
+4.39
46.74%
jan 1, 1983
24.983
+11.199
81.24%
jan 1, 1984
17.864
-7.119
-28.49%
jan 1, 1985
18.703
+0.838
4.69%
jan 1, 1986
17.453
-1.249
-6.68%
jan 1, 1987
18.839
+1.385
7.94%
jan 1, 1988
14.661
-4.177
-22.17%
jan 1, 1989
15.002
+0.341
2.32%
jan 1, 1990
10.605
-4.397
-29.31%
jan 1, 1991
11.719
+1.114
10.5%
jan 1, 1992
16.067
+4.349
37.11%
jan 1, 1993
23.886
+7.818
48.66%
jan 1, 1994
18.766
-5.12
-21.43%
jan 1, 2002
21.115
+2.349
12.52%
jan 1, 2003
28.067
+6.952
32.92%
jan 1, 2004
9.344
-18.723
-66.71%
jan 1, 2005
11.043
+1.699
18.18%
jan 1, 2006
9.382
-1.66
-15.04%
jan 1, 2007
9.801
+0.419
4.47%
jan 1, 2008
12.887
+3.086
31.48%
jan 1, 2009
13.896
+1.009
7.83%
jan 1, 2010
15.509
+1.613
11.6%
jan 1, 2011
16.703
+1.194
7.7%
jan 1, 2012
15.996
-0.706
-4.23%
jan 1, 2013
15.343
-0.653
-4.08%
jan 1, 2014
16.65
+1.307
8.52%
Ranking of countries by current statistics by years


Comments: