29
/
en
AIzaSyAYiBZKx7MnpbEhh9jyipgxe19OcubqV5w
April 1, 2024
105561
Chile
CHL
true
2
1
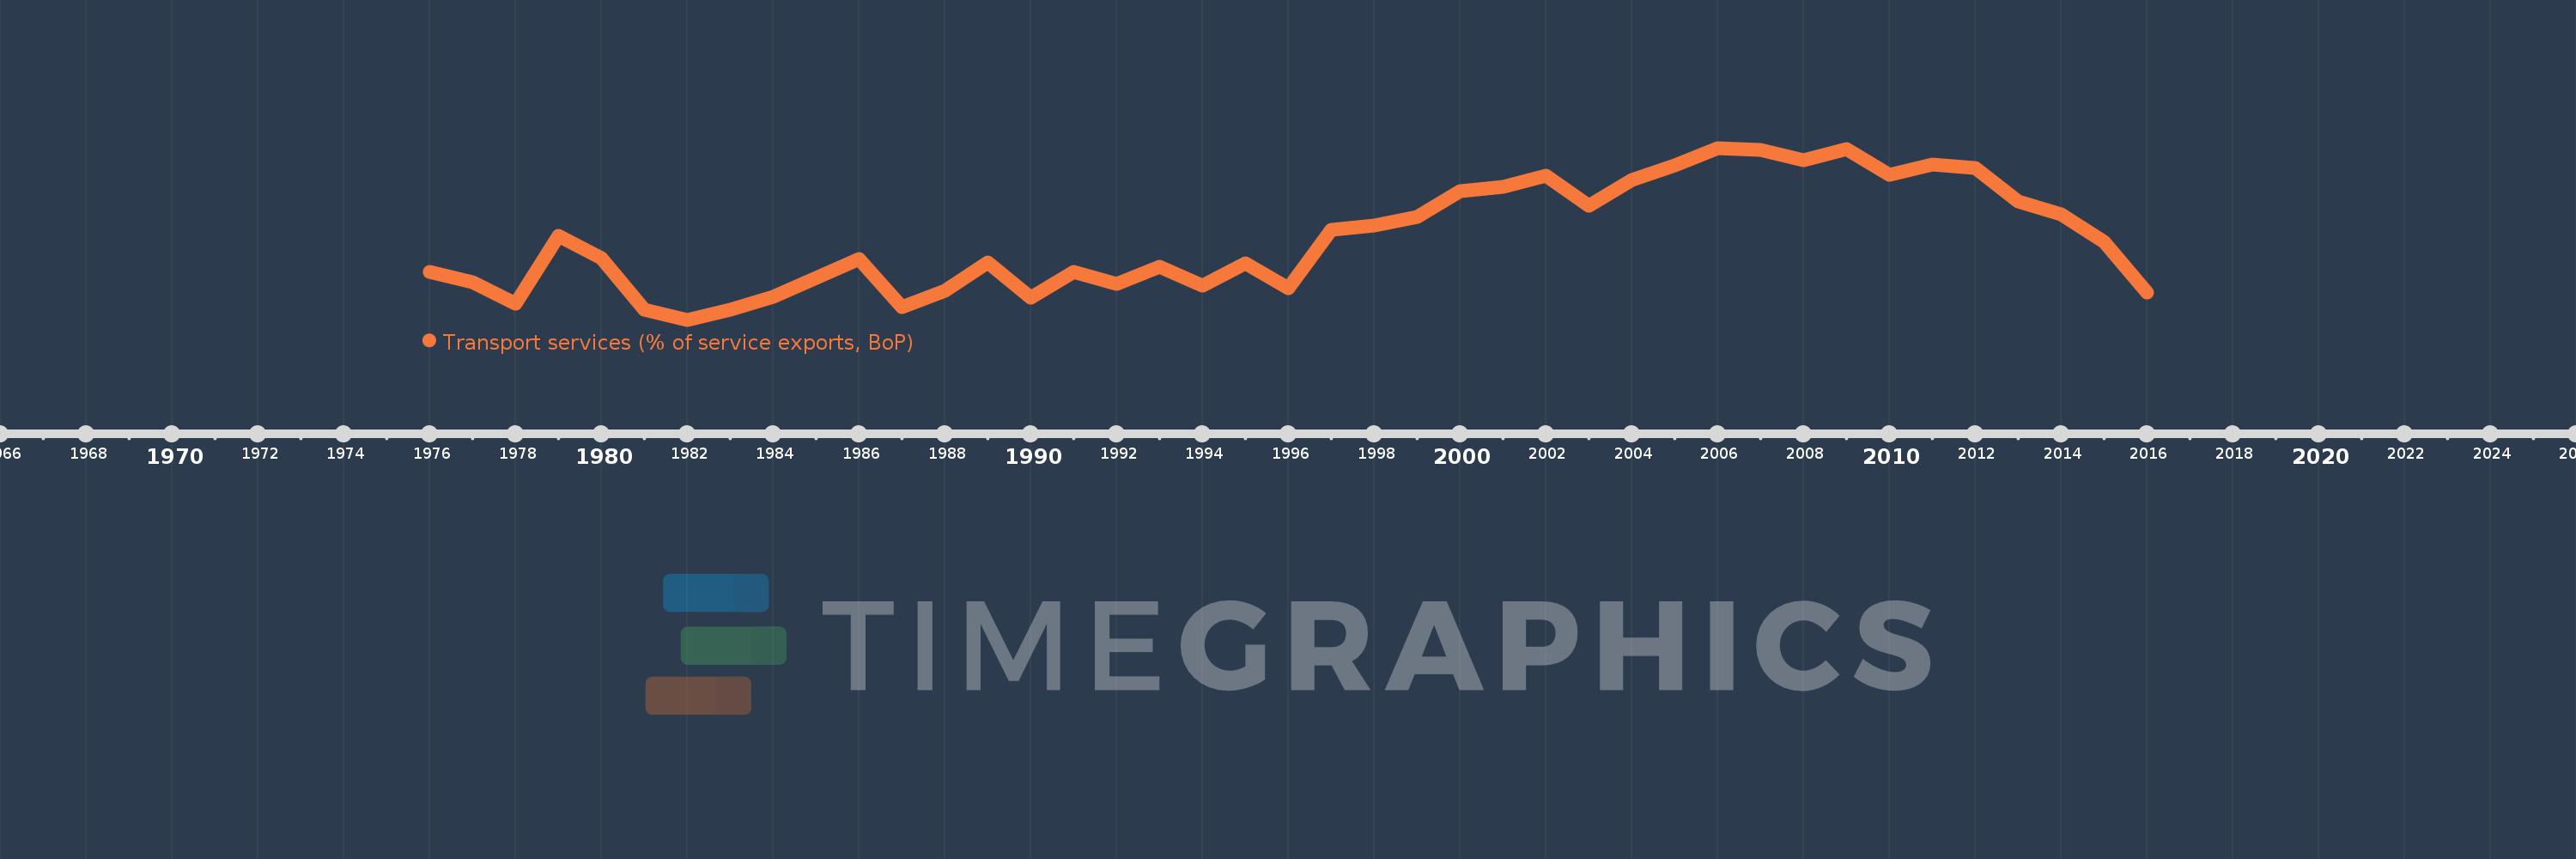
Transport services (% of service exports, BoP)
2016,2015,2014,2013,2012,2011,2010,2009,2008,2007,2006,2005,2004,2003,2002,2001,2000,1999,1998,1997,1996,1995,1994,1993,1992,1991,1990,1989,1988,1987,1986,1985,1984,1983,1982,1981,1980,1979,1978,1977,1976
This statistics in other country:
AfghanistanAlbaniaAlgeriaAngolaAntigua and BarbudaArab WorldArgentinaArmeniaArubaAustraliaAustriaAzerbaijanBahamas, TheBahrainBangladeshBarbadosBelarusBelgiumBelizeBeninBermudaBhutanBoliviaBosnia and HerzegovinaBotswanaBrazilBrunei DarussalamBulgariaBurkina FasoBurundiCabo VerdeCambodiaCameroonCanadaCaribbean small statesCentral African RepublicCentral Europe and the BalticsChadChileChinaColombiaComorosCongo, Dem. Rep.Congo, Rep.Costa RicaCote d'IvoireCroatiaCuracaoCyprusCzech RepublicDenmarkDjiboutiDominicaDominican RepublicEarly-demographic dividendEast Asia & PacificEast Asia & Pacific (excluding high income)East Asia & Pacific (IDA & IBRD countries)EcuadorEgypt, Arab Rep.El SalvadorEritreaEstoniaEthiopiaEuro areaEurope & Central AsiaEurope & Central Asia (excluding high income)Europe & Central Asia (IDA & IBRD countries)European UnionFaroe IslandsFijiFinlandFragile and conflict affected situationsFranceFrench PolynesiaGabonGambia, TheGeorgiaGermanyGhanaGreeceGrenadaGuatemalaGuineaGuinea-BissauGuyanaHaitiHeavily indebted poor countries (HIPC)High incomeHondurasHong Kong SAR, ChinaHungaryIBRD onlyIcelandIDA & IBRD totalIDA onlyIDA totalIndiaIndonesiaIran, Islamic Rep.IraqIrelandIsraelItalyJamaicaJapanJordanKazakhstanKenyaKiribatiKorea, Rep.KosovoKuwaitKyrgyz RepublicLao PDRLate-demographic dividendLatin America & Caribbean Latin America & Caribbean (excluding high income)Latin America & the Caribbean (IDA & IBRD countries)LatviaLeast developed countries: UN classificationLebanonLesothoLiberiaLibyaLithuaniaLow & middle incomeLow incomeLower middle incomeLuxembourgMacao SAR, ChinaMacedonia, FYRMadagascarMalawiMalaysiaMaldivesMaliMaltaMarshall IslandsMauritaniaMauritiusMexicoMicronesia, Fed. Sts.Middle East & North AfricaMiddle East & North Africa (excluding high income)Middle East & North Africa (IDA & IBRD countries)Middle incomeMoldovaMongoliaMontenegroMoroccoMozambiqueMyanmarNamibiaNepalNetherlandsNew CaledoniaNew ZealandNicaraguaNigerNigeriaNorth AmericaNorwayOECD membersOmanOther small statesPacific island small statesPakistanPalauPanamaPapua New GuineaParaguayPeruPhilippinesPolandPortugalPost-demographic dividendPre-demographic dividendQatarRomaniaRussian FederationRwandaSamoaSao Tome and PrincipeSaudi ArabiaSenegalSerbiaSeychellesSierra LeoneSingaporeSint Maarten (Dutch part)Slovak RepublicSloveniaSmall statesSolomon IslandsSouth AfricaSouth AsiaSouth Asia (IDA & IBRD)South SudanSpainSri LankaSt. Kitts and NevisSt. LuciaSt. Vincent and the GrenadinesSub-Saharan Africa Sub-Saharan Africa (excluding high income)Sub-Saharan Africa (IDA & IBRD countries)SudanSurinameSwazilandSwedenSwitzerlandSyrian Arab RepublicTajikistanTanzaniaThailandTimor-LesteTogoTongaTrinidad and TobagoTunisiaTurkeyTuvaluUgandaUkraineUnited KingdomUnited StatesUpper middle incomeUruguayVanuatuVenezuela, RBWest Bank and GazaWorldYemen, Rep.ZambiaZimbabwe Timeline:
This timeline shows a graph from 1976 to 2016 of Chile. No data until 1975. Number of actual observations by date: 41.
Source name:
World Development Indicators
Source organization:
International Monetary Fund, Balance of Payments Statistics Yearbook and data files.
Categories, topics:
Economy & Growth, Trade
Last updated:
apr 23, 2017
Indicators value changes by year
Minimum:
30.375
jan 1, 1982
Maximum:
60.284
jan 1, 2006
At the date of observation
Value
Absolute change
Change from previous value
jan 1, 1976
38.71
+38.71
0.0%
jan 1, 1977
36.97
-1.74
-4.49%
jan 1, 1978
33.141
-3.828
-10.35%
jan 1, 1979
45.052
+11.91
35.94%
jan 1, 1980
41.108
-3.944
-8.75%
jan 1, 1981
32.162
-8.947
-21.76%
jan 1, 1982
30.375
-1.786
-5.55%
jan 1, 1983
32.115
+1.74
5.73%
jan 1, 1984
34.417
+2.301
7.17%
jan 1, 1985
37.605
+3.189
9.27%
jan 1, 1986
41.01
+3.404
9.05%
jan 1, 1987
32.563
-8.447
-20.6%
jan 1, 1988
35.407
+2.844
8.73%
jan 1, 1989
40.279
+4.872
13.76%
jan 1, 1990
34.284
-5.995
-14.88%
jan 1, 1991
38.634
+4.35
12.69%
jan 1, 1992
36.677
-1.958
-5.07%
jan 1, 1993
39.619
+2.942
8.02%
jan 1, 1994
36.307
-3.312
-8.36%
jan 1, 1995
40.213
+3.906
10.76%
jan 1, 1996
35.825
-4.388
-10.91%
jan 1, 1997
46.001
+10.176
28.41%
jan 1, 1998
46.706
+0.705
1.53%
jan 1, 1999
48.332
+1.626
3.48%
jan 1, 2000
52.695
+4.363
9.03%
jan 1, 2001
53.575
+0.88
1.67%
jan 1, 2002
55.428
+1.852
3.46%
jan 1, 2003
50.27
-5.158
-9.31%
jan 1, 2004
54.64
+4.371
8.69%
jan 1, 2005
57.287
+2.646
4.84%
jan 1, 2006
60.284
+2.997
5.23%
jan 1, 2007
59.943
-0.341
-0.57%
jan 1, 2008
58.167
-1.775
-2.96%
jan 1, 2009
60.083
+1.916
3.29%
jan 1, 2010
55.582
-4.501
-7.49%
jan 1, 2011
57.356
+1.774
3.19%
jan 1, 2012
56.844
-0.512
-0.89%
jan 1, 2013
51.01
-5.834
-10.26%
jan 1, 2014
48.667
-2.343
-4.59%
jan 1, 2015
43.936
-4.731
-9.72%
jan 1, 2016
35.182
-8.754
-19.92%
Ranking of countries by current statistics by years


Comments: