29
/
en
AIzaSyAYiBZKx7MnpbEhh9jyipgxe19OcubqV5w
April 1, 2024
47819
Lower middle income
LMC
false
2
1
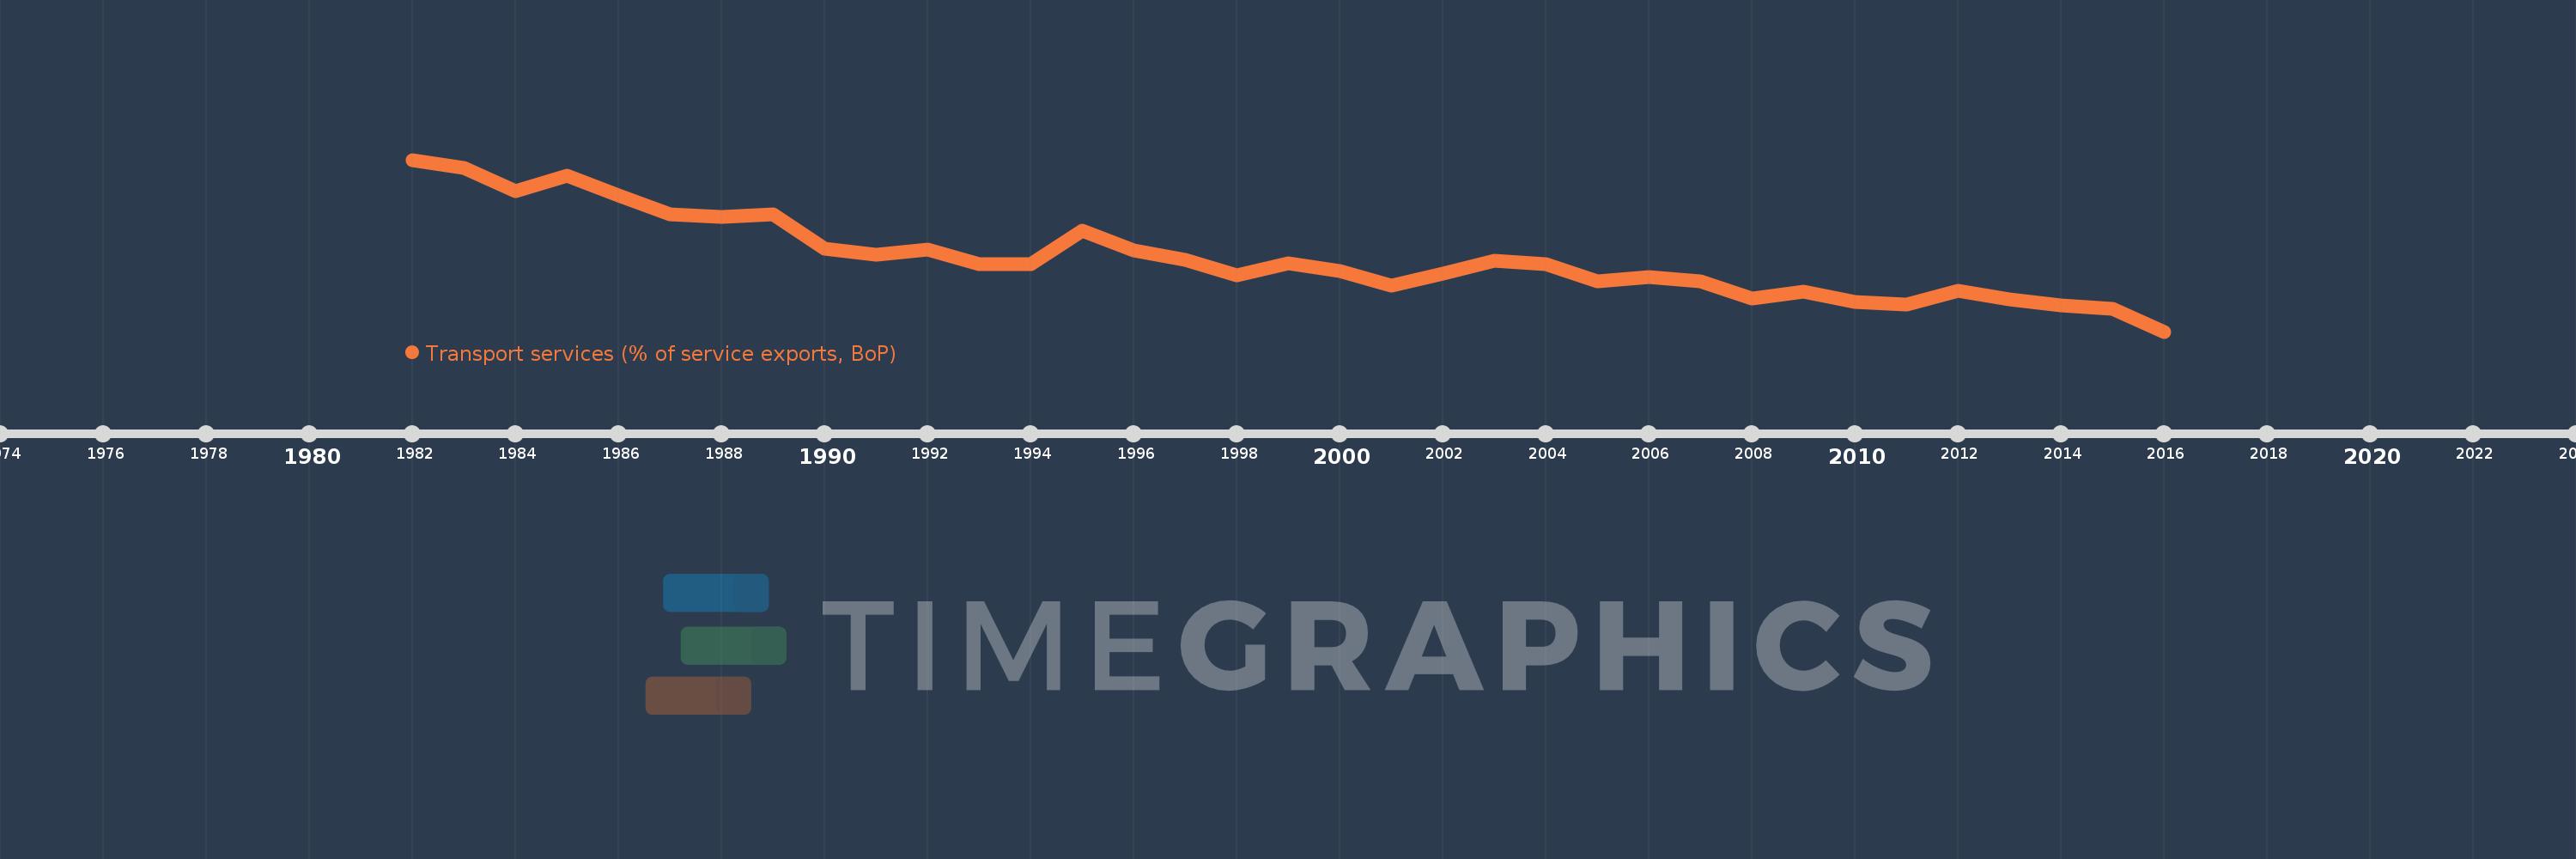
Transport services (% of service exports, BoP)
2016,2015,2014,2013,2012,2011,2010,2009,2008,2007,2006,2005,2004,2003,2002,2001,2000,1999,1998,1997,1996,1995,1994,1993,1992,1991,1990,1989,1988,1987,1986,1985,1984,1983,1982
This statistics in other country:
AfghanistanAlbaniaAlgeriaAngolaAntigua and BarbudaArab WorldArgentinaArmeniaArubaAustraliaAustriaAzerbaijanBahamas, TheBahrainBangladeshBarbadosBelarusBelgiumBelizeBeninBermudaBhutanBoliviaBosnia and HerzegovinaBotswanaBrazilBrunei DarussalamBulgariaBurkina FasoBurundiCabo VerdeCambodiaCameroonCanadaCaribbean small statesCentral African RepublicCentral Europe and the BalticsChadChileChinaColombiaComorosCongo, Dem. Rep.Congo, Rep.Costa RicaCote d'IvoireCroatiaCuracaoCyprusCzech RepublicDenmarkDjiboutiDominicaDominican RepublicEarly-demographic dividendEast Asia & PacificEast Asia & Pacific (excluding high income)East Asia & Pacific (IDA & IBRD countries)EcuadorEgypt, Arab Rep.El SalvadorEritreaEstoniaEthiopiaEuro areaEurope & Central AsiaEurope & Central Asia (excluding high income)Europe & Central Asia (IDA & IBRD countries)European UnionFaroe IslandsFijiFinlandFragile and conflict affected situationsFranceFrench PolynesiaGabonGambia, TheGeorgiaGermanyGhanaGreeceGrenadaGuatemalaGuineaGuinea-BissauGuyanaHaitiHeavily indebted poor countries (HIPC)High incomeHondurasHong Kong SAR, ChinaHungaryIBRD onlyIcelandIDA & IBRD totalIDA onlyIDA totalIndiaIndonesiaIran, Islamic Rep.IraqIrelandIsraelItalyJamaicaJapanJordanKazakhstanKenyaKiribatiKorea, Rep.KosovoKuwaitKyrgyz RepublicLao PDRLate-demographic dividendLatin America & Caribbean Latin America & Caribbean (excluding high income)Latin America & the Caribbean (IDA & IBRD countries)LatviaLeast developed countries: UN classificationLebanonLesothoLiberiaLibyaLithuaniaLow & middle incomeLow incomeLower middle incomeLuxembourgMacao SAR, ChinaMacedonia, FYRMadagascarMalawiMalaysiaMaldivesMaliMaltaMarshall IslandsMauritaniaMauritiusMexicoMicronesia, Fed. Sts.Middle East & North AfricaMiddle East & North Africa (excluding high income)Middle East & North Africa (IDA & IBRD countries)Middle incomeMoldovaMongoliaMontenegroMoroccoMozambiqueMyanmarNamibiaNepalNetherlandsNew CaledoniaNew ZealandNicaraguaNigerNigeriaNorth AmericaNorwayOECD membersOmanOther small statesPacific island small statesPakistanPalauPanamaPapua New GuineaParaguayPeruPhilippinesPolandPortugalPost-demographic dividendPre-demographic dividendQatarRomaniaRussian FederationRwandaSamoaSao Tome and PrincipeSaudi ArabiaSenegalSerbiaSeychellesSierra LeoneSingaporeSint Maarten (Dutch part)Slovak RepublicSloveniaSmall statesSolomon IslandsSouth AfricaSouth AsiaSouth Asia (IDA & IBRD)South SudanSpainSri LankaSt. Kitts and NevisSt. LuciaSt. Vincent and the GrenadinesSub-Saharan Africa Sub-Saharan Africa (excluding high income)Sub-Saharan Africa (IDA & IBRD countries)SudanSurinameSwazilandSwedenSwitzerlandSyrian Arab RepublicTajikistanTanzaniaThailandTimor-LesteTogoTongaTrinidad and TobagoTunisiaTurkeyTuvaluUgandaUkraineUnited KingdomUnited StatesUpper middle incomeUruguayVanuatuVenezuela, RBWest Bank and GazaWorldYemen, Rep.ZambiaZimbabwe Timeline:
This timeline shows a graph from 1982 to 2016 of Lower middle income. No data until 1981. Number of actual observations by date: 35.
Source name:
World Development Indicators
Source organization:
International Monetary Fund, Balance of Payments Statistics Yearbook and data files.
Categories, topics:
Economy & Growth, Trade
Last updated:
apr 23, 2017
Indicators value changes by year
Maximum:
31.139
jan 1, 1982
At the date of observation
Value
Absolute change
Change from previous value
jan 1, 1982
31.139
+31.139
0.0%
jan 1, 1983
30.43
-0.709
-2.28%
jan 1, 1984
28.312
-2.119
-6.96%
jan 1, 1985
29.709
+1.398
4.94%
jan 1, 1986
27.932
-1.777
-5.98%
jan 1, 1987
26.236
-1.696
-6.07%
jan 1, 1988
26.044
-0.192
-0.73%
jan 1, 1989
26.265
+0.221
0.85%
jan 1, 1990
23.194
-3.071
-11.69%
jan 1, 1991
22.608
-0.586
-2.53%
jan 1, 1992
23.078
+0.47
2.08%
jan 1, 1993
21.768
-1.31
-5.68%
jan 1, 1994
21.735
-0.032
-0.15%
jan 1, 1995
24.778
+3.042
14.0%
jan 1, 1996
22.974
-1.803
-7.28%
jan 1, 1997
22.176
-0.798
-3.47%
jan 1, 1998
20.751
-1.425
-6.42%
jan 1, 1999
21.844
+1.093
5.27%
jan 1, 2000
21.183
-0.661
-3.03%
jan 1, 2001
19.848
-1.335
-6.3%
jan 1, 2002
20.927
+1.079
5.44%
jan 1, 2003
22.11
+1.183
5.65%
jan 1, 2004
21.788
-0.321
-1.45%
jan 1, 2005
20.203
-1.586
-7.28%
jan 1, 2006
20.64
+0.437
2.16%
jan 1, 2007
20.245
-0.395
-1.91%
jan 1, 2008
18.672
-1.572
-7.77%
jan 1, 2009
19.278
+0.606
3.25%
jan 1, 2010
18.362
-0.917
-4.75%
jan 1, 2011
18.138
-0.224
-1.22%
jan 1, 2012
19.4
+1.262
6.96%
jan 1, 2013
18.591
-0.809
-4.17%
jan 1, 2014
18.103
-0.489
-2.63%
jan 1, 2015
17.758
-0.345
-1.9%
jan 1, 2016
15.72
-2.038
-11.48%
Ranking of countries by current statistics by years


Comments: