29
/
en
AIzaSyAYiBZKx7MnpbEhh9jyipgxe19OcubqV5w
April 1, 2024
202411
Morocco
MAR
true
2
1
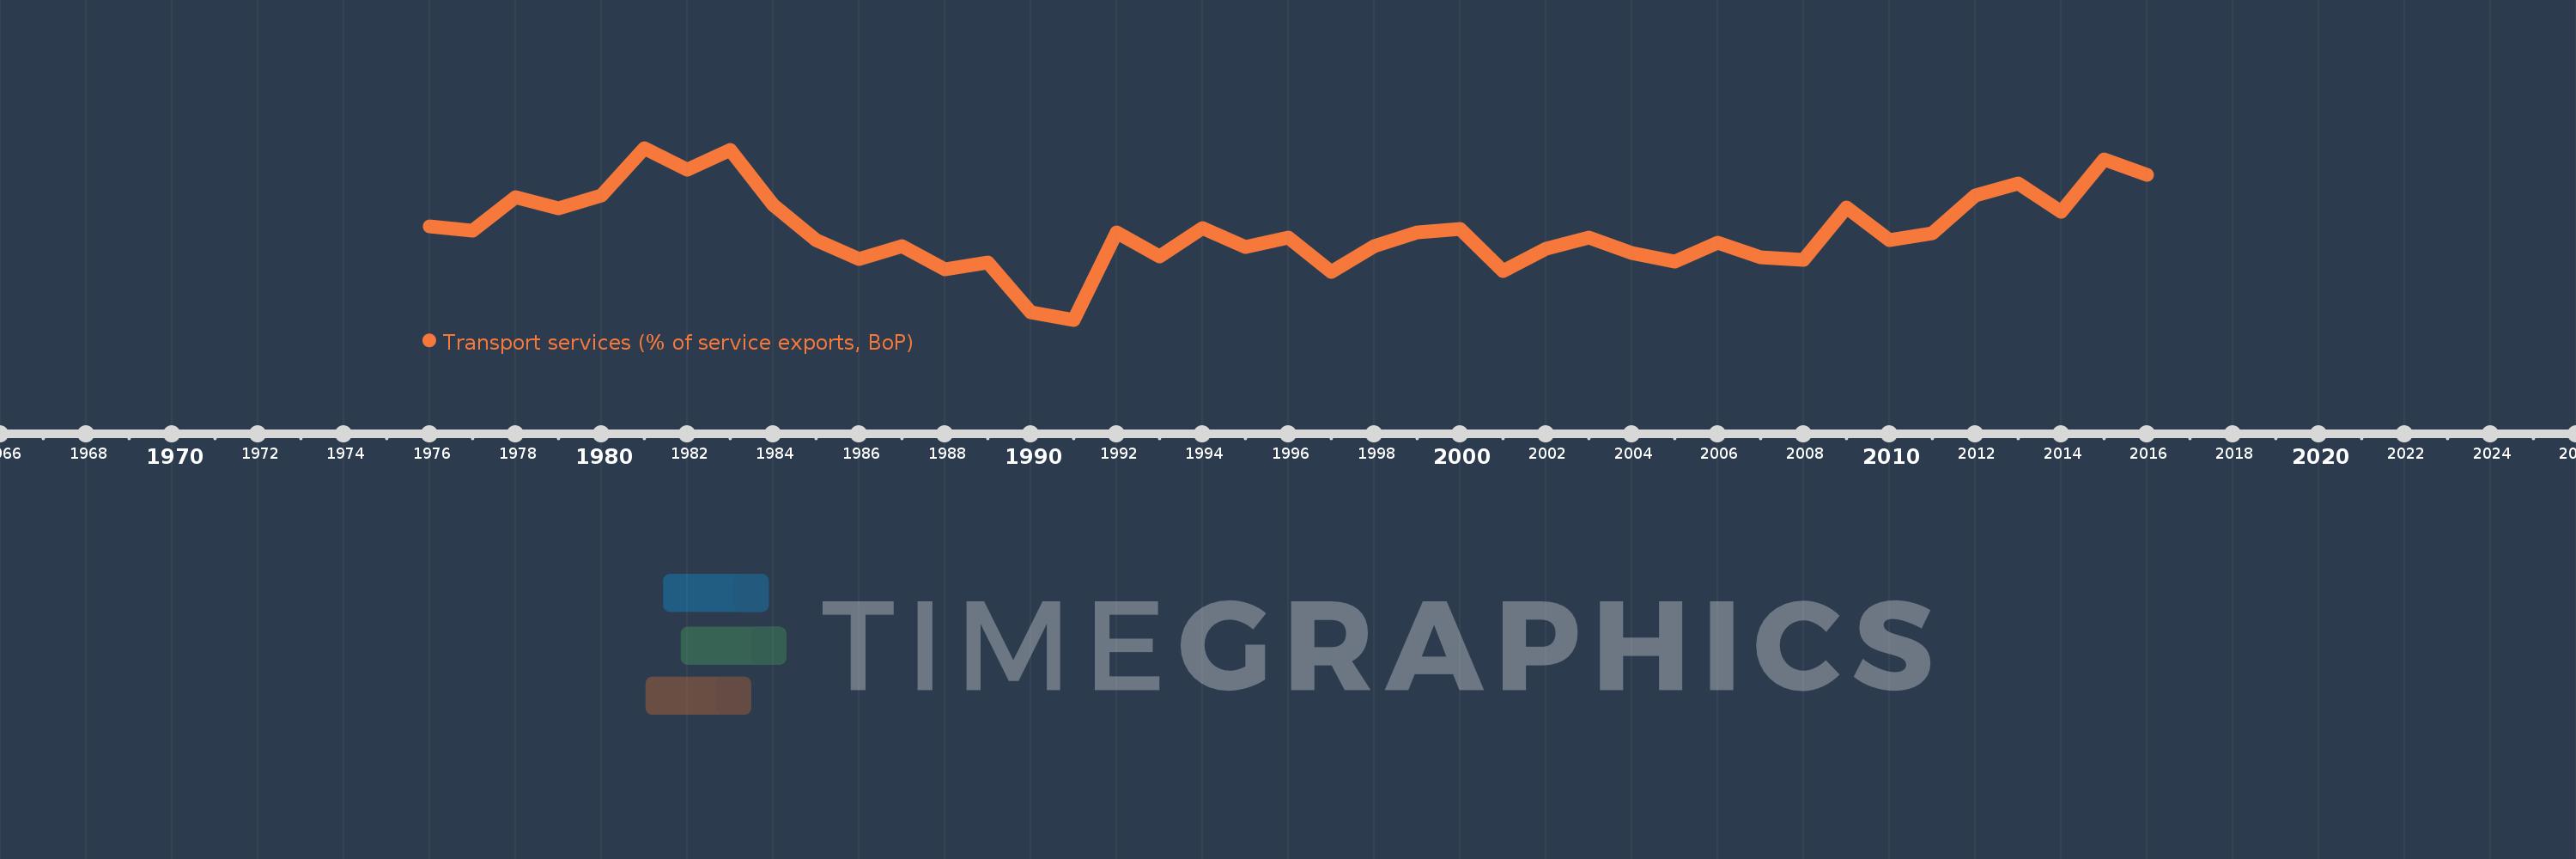
Transport services (% of service exports, BoP)
2016,2015,2014,2013,2012,2011,2010,2009,2008,2007,2006,2005,2004,2003,2002,2001,2000,1999,1998,1997,1996,1995,1994,1993,1992,1991,1990,1989,1988,1987,1986,1985,1984,1983,1982,1981,1980,1979,1978,1977,1976
This statistics in other country:
AfghanistanAlbaniaAlgeriaAngolaAntigua and BarbudaArab WorldArgentinaArmeniaArubaAustraliaAustriaAzerbaijanBahamas, TheBahrainBangladeshBarbadosBelarusBelgiumBelizeBeninBermudaBhutanBoliviaBosnia and HerzegovinaBotswanaBrazilBrunei DarussalamBulgariaBurkina FasoBurundiCabo VerdeCambodiaCameroonCanadaCaribbean small statesCentral African RepublicCentral Europe and the BalticsChadChileChinaColombiaComorosCongo, Dem. Rep.Congo, Rep.Costa RicaCote d'IvoireCroatiaCuracaoCyprusCzech RepublicDenmarkDjiboutiDominicaDominican RepublicEarly-demographic dividendEast Asia & PacificEast Asia & Pacific (excluding high income)East Asia & Pacific (IDA & IBRD countries)EcuadorEgypt, Arab Rep.El SalvadorEritreaEstoniaEthiopiaEuro areaEurope & Central AsiaEurope & Central Asia (excluding high income)Europe & Central Asia (IDA & IBRD countries)European UnionFaroe IslandsFijiFinlandFragile and conflict affected situationsFranceFrench PolynesiaGabonGambia, TheGeorgiaGermanyGhanaGreeceGrenadaGuatemalaGuineaGuinea-BissauGuyanaHaitiHeavily indebted poor countries (HIPC)High incomeHondurasHong Kong SAR, ChinaHungaryIBRD onlyIcelandIDA & IBRD totalIDA onlyIDA totalIndiaIndonesiaIran, Islamic Rep.IraqIrelandIsraelItalyJamaicaJapanJordanKazakhstanKenyaKiribatiKorea, Rep.KosovoKuwaitKyrgyz RepublicLao PDRLate-demographic dividendLatin America & Caribbean Latin America & Caribbean (excluding high income)Latin America & the Caribbean (IDA & IBRD countries)LatviaLeast developed countries: UN classificationLebanonLesothoLiberiaLibyaLithuaniaLow & middle incomeLow incomeLower middle incomeLuxembourgMacao SAR, ChinaMacedonia, FYRMadagascarMalawiMalaysiaMaldivesMaliMaltaMarshall IslandsMauritaniaMauritiusMexicoMicronesia, Fed. Sts.Middle East & North AfricaMiddle East & North Africa (excluding high income)Middle East & North Africa (IDA & IBRD countries)Middle incomeMoldovaMongoliaMontenegroMoroccoMozambiqueMyanmarNamibiaNepalNetherlandsNew CaledoniaNew ZealandNicaraguaNigerNigeriaNorth AmericaNorwayOECD membersOmanOther small statesPacific island small statesPakistanPalauPanamaPapua New GuineaParaguayPeruPhilippinesPolandPortugalPost-demographic dividendPre-demographic dividendQatarRomaniaRussian FederationRwandaSamoaSao Tome and PrincipeSaudi ArabiaSenegalSerbiaSeychellesSierra LeoneSingaporeSint Maarten (Dutch part)Slovak RepublicSloveniaSmall statesSolomon IslandsSouth AfricaSouth AsiaSouth Asia (IDA & IBRD)South SudanSpainSri LankaSt. Kitts and NevisSt. LuciaSt. Vincent and the GrenadinesSub-Saharan Africa Sub-Saharan Africa (excluding high income)Sub-Saharan Africa (IDA & IBRD countries)SudanSurinameSwazilandSwedenSwitzerlandSyrian Arab RepublicTajikistanTanzaniaThailandTimor-LesteTogoTongaTrinidad and TobagoTunisiaTurkeyTuvaluUgandaUkraineUnited KingdomUnited StatesUpper middle incomeUruguayVanuatuVenezuela, RBWest Bank and GazaWorldYemen, Rep.ZambiaZimbabwe Timeline:
This timeline shows a graph from 1976 to 2016 of Morocco. No data until 1975. Number of actual observations by date: 41.
Source name:
World Development Indicators
Source organization:
International Monetary Fund, Balance of Payments Statistics Yearbook and data files.
Categories, topics:
Economy & Growth, Trade
Last updated:
apr 23, 2017
Indicators value changes by year
Maximum:
20.335
jan 1, 1981
At the date of observation
Value
Absolute change
Change from previous value
jan 1, 1976
15.129
+15.129
0.0%
jan 1, 1977
14.838
-0.291
-1.92%
jan 1, 1978
17.055
+2.216
14.94%
jan 1, 1979
16.308
-0.746
-4.38%
jan 1, 1980
17.181
+0.873
5.35%
jan 1, 1981
20.335
+3.154
18.36%
jan 1, 1982
18.91
-1.426
-7.01%
jan 1, 1983
20.192
+1.282
6.78%
jan 1, 1984
16.571
-3.62
-17.93%
jan 1, 1985
14.202
-2.369
-14.3%
jan 1, 1986
12.958
-1.244
-8.76%
jan 1, 1987
13.819
+0.861
6.64%
jan 1, 1988
12.27
-1.549
-11.21%
jan 1, 1989
12.744
+0.474
3.86%
jan 1, 1990
9.405
-3.339
-26.2%
jan 1, 1991
8.932
-0.474
-5.04%
jan 1, 1992
14.719
+5.787
64.79%
jan 1, 1993
13.111
-1.608
-10.92%
jan 1, 1994
15.037
+1.926
14.69%
jan 1, 1995
13.775
-1.263
-8.4%
jan 1, 1996
14.371
+0.596
4.33%
jan 1, 1997
12.108
-2.263
-15.75%
jan 1, 1998
13.811
+1.703
14.07%
jan 1, 1999
14.714
+0.903
6.54%
jan 1, 2000
14.947
+0.233
1.58%
jan 1, 2001
12.153
-2.794
-18.69%
jan 1, 2002
13.619
+1.466
12.06%
jan 1, 2003
14.388
+0.77
5.65%
jan 1, 2004
13.377
-1.011
-7.03%
jan 1, 2005
12.791
-0.586
-4.38%
jan 1, 2006
14.037
+1.246
9.74%
jan 1, 2007
13.084
-0.953
-6.79%
jan 1, 2008
12.923
-0.161
-1.23%
jan 1, 2009
16.393
+3.469
26.85%
jan 1, 2010
14.216
-2.176
-13.28%
jan 1, 2011
14.651
+0.435
3.06%
jan 1, 2012
17.192
+2.542
17.35%
jan 1, 2013
17.987
+0.794
4.62%
jan 1, 2014
16.103
-1.884
-10.47%
jan 1, 2015
19.551
+3.448
21.41%
jan 1, 2016
18.559
-0.992
-5.07%
Ranking of countries by current statistics by years


Comments: