29
/
en
AIzaSyAYiBZKx7MnpbEhh9jyipgxe19OcubqV5w
April 1, 2024
35453
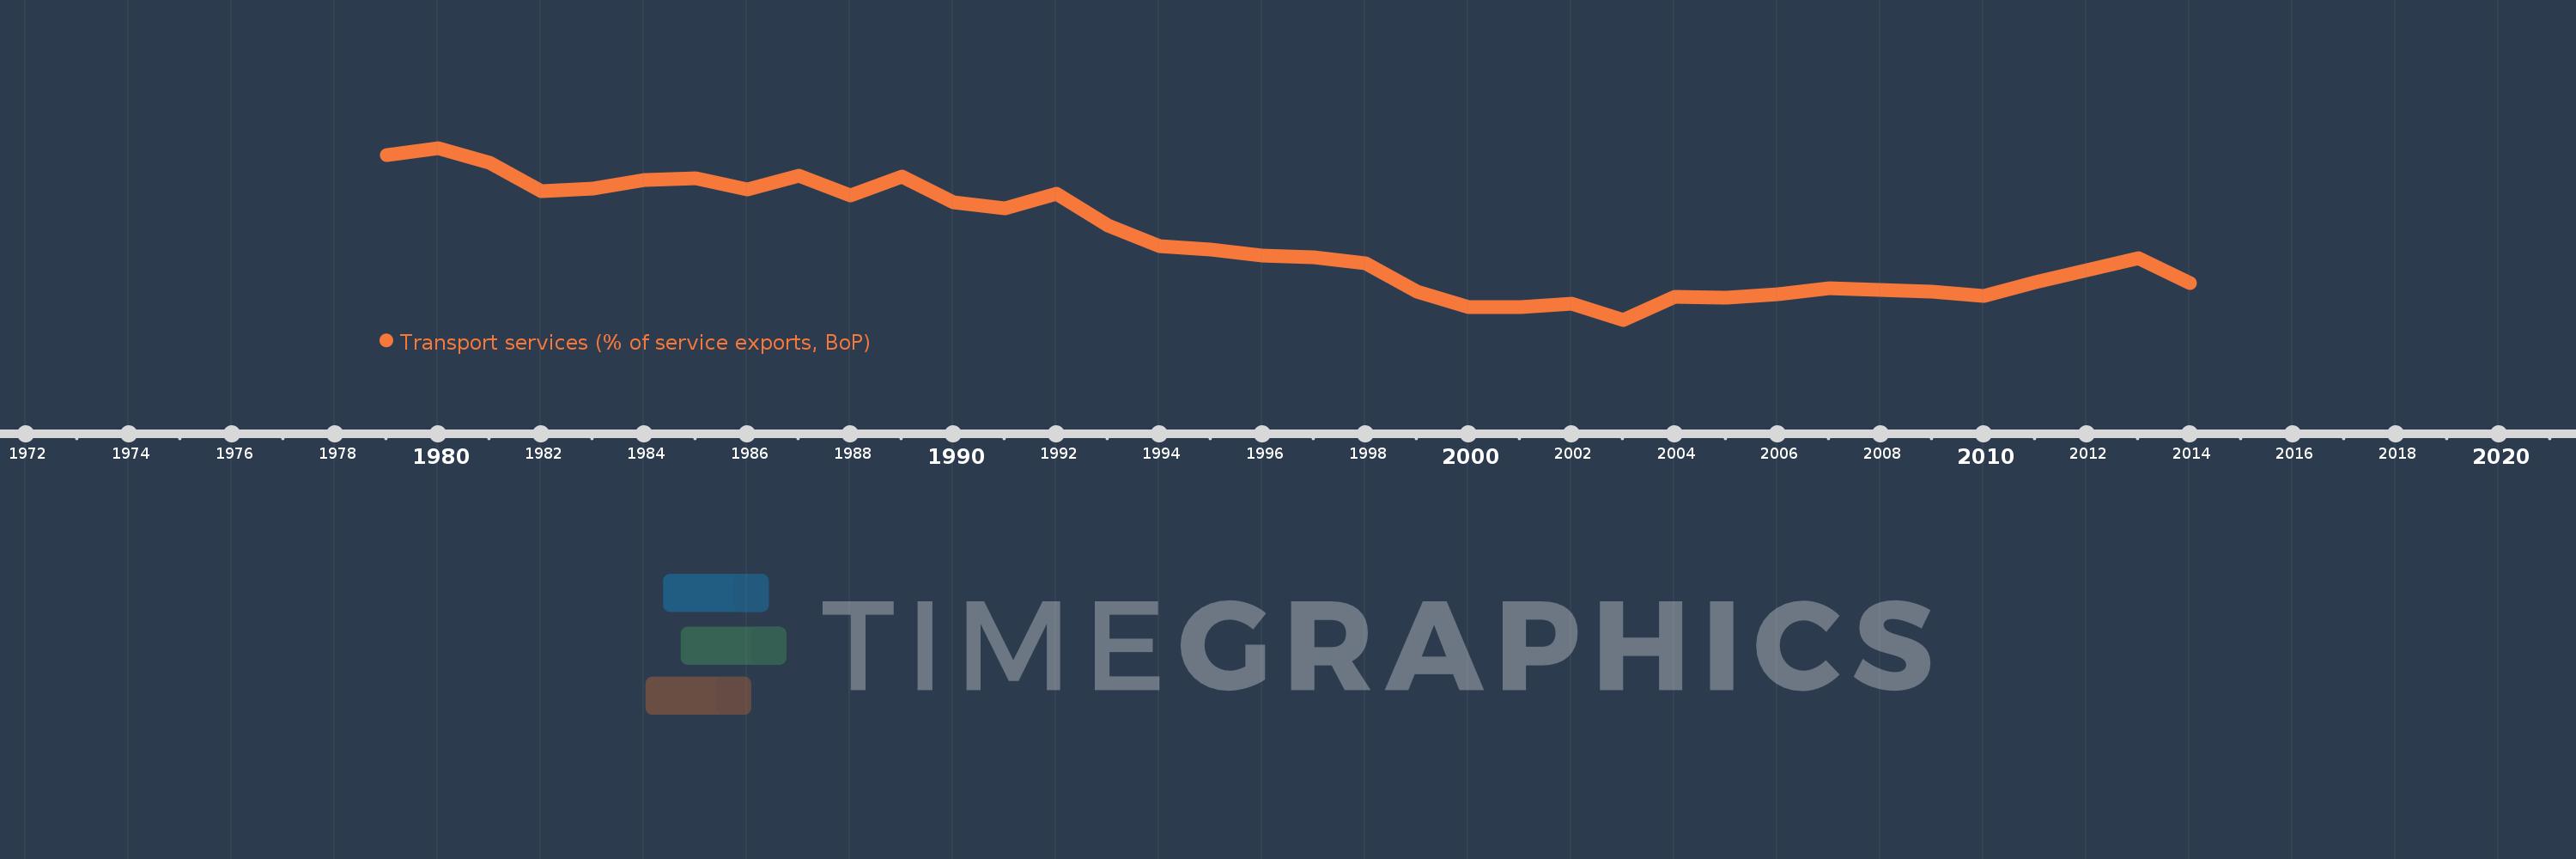
Heavily indebted poor countries (HIPC)
HPC
false
2
1
Transport services (% of service exports, BoP)
2014,2013,2012,2011,2010,2009,2008,2007,2006,2005,2004,2003,2002,2001,2000,1999,1998,1997,1996,1995,1994,1993,1992,1991,1990,1989,1988,1987,1986,1985,1984,1983,1982,1981,1980,1979
This statistics in other country:
AfghanistanAlbaniaAlgeriaAngolaAntigua and BarbudaArab WorldArgentinaArmeniaArubaAustraliaAustriaAzerbaijanBahamas, TheBahrainBangladeshBarbadosBelarusBelgiumBelizeBeninBermudaBhutanBoliviaBosnia and HerzegovinaBotswanaBrazilBrunei DarussalamBulgariaBurkina FasoBurundiCabo VerdeCambodiaCameroonCanadaCaribbean small statesCentral African RepublicCentral Europe and the BalticsChadChileChinaColombiaComorosCongo, Dem. Rep.Congo, Rep.Costa RicaCote d'IvoireCroatiaCuracaoCyprusCzech RepublicDenmarkDjiboutiDominicaDominican RepublicEarly-demographic dividendEast Asia & PacificEast Asia & Pacific (excluding high income)East Asia & Pacific (IDA & IBRD countries)EcuadorEgypt, Arab Rep.El SalvadorEritreaEstoniaEthiopiaEuro areaEurope & Central AsiaEurope & Central Asia (excluding high income)Europe & Central Asia (IDA & IBRD countries)European UnionFaroe IslandsFijiFinlandFragile and conflict affected situationsFranceFrench PolynesiaGabonGambia, TheGeorgiaGermanyGhanaGreeceGrenadaGuatemalaGuineaGuinea-BissauGuyanaHaitiHeavily indebted poor countries (HIPC)High incomeHondurasHong Kong SAR, ChinaHungaryIBRD onlyIcelandIDA & IBRD totalIDA onlyIDA totalIndiaIndonesiaIran, Islamic Rep.IraqIrelandIsraelItalyJamaicaJapanJordanKazakhstanKenyaKiribatiKorea, Rep.KosovoKuwaitKyrgyz RepublicLao PDRLate-demographic dividendLatin America & Caribbean Latin America & Caribbean (excluding high income)Latin America & the Caribbean (IDA & IBRD countries)LatviaLeast developed countries: UN classificationLebanonLesothoLiberiaLibyaLithuaniaLow & middle incomeLow incomeLower middle incomeLuxembourgMacao SAR, ChinaMacedonia, FYRMadagascarMalawiMalaysiaMaldivesMaliMaltaMarshall IslandsMauritaniaMauritiusMexicoMicronesia, Fed. Sts.Middle East & North AfricaMiddle East & North Africa (excluding high income)Middle East & North Africa (IDA & IBRD countries)Middle incomeMoldovaMongoliaMontenegroMoroccoMozambiqueMyanmarNamibiaNepalNetherlandsNew CaledoniaNew ZealandNicaraguaNigerNigeriaNorth AmericaNorwayOECD membersOmanOther small statesPacific island small statesPakistanPalauPanamaPapua New GuineaParaguayPeruPhilippinesPolandPortugalPost-demographic dividendPre-demographic dividendQatarRomaniaRussian FederationRwandaSamoaSao Tome and PrincipeSaudi ArabiaSenegalSerbiaSeychellesSierra LeoneSingaporeSint Maarten (Dutch part)Slovak RepublicSloveniaSmall statesSolomon IslandsSouth AfricaSouth AsiaSouth Asia (IDA & IBRD)South SudanSpainSri LankaSt. Kitts and NevisSt. LuciaSt. Vincent and the GrenadinesSub-Saharan Africa Sub-Saharan Africa (excluding high income)Sub-Saharan Africa (IDA & IBRD countries)SudanSurinameSwazilandSwedenSwitzerlandSyrian Arab RepublicTajikistanTanzaniaThailandTimor-LesteTogoTongaTrinidad and TobagoTunisiaTurkeyTuvaluUgandaUkraineUnited KingdomUnited StatesUpper middle incomeUruguayVanuatuVenezuela, RBWest Bank and GazaWorldYemen, Rep.ZambiaZimbabwe Timeline:
This timeline shows a graph from 1979 to 2014 of Heavily indebted poor countries (HIPC). No data until 1978. Number of actual observations by date: 36.
Source name:
World Development Indicators
Source organization:
International Monetary Fund, Balance of Payments Statistics Yearbook and data files.
Categories, topics:
Economy & Growth, Trade
Last updated:
apr 23, 2017
Indicators value changes by year
Minimum:
14.402
jan 1, 2003
Maximum:
36.141
jan 1, 1980
At the date of observation
Value
Absolute change
Change from previous value
jan 1, 1979
35.199
+35.199
0.0%
jan 1, 1980
36.141
+0.942
2.68%
jan 1, 1981
34.282
-1.859
-5.14%
jan 1, 1982
30.695
-3.587
-10.46%
jan 1, 1983
31.032
+0.336
1.1%
jan 1, 1984
32.123
+1.092
3.52%
jan 1, 1985
32.284
+0.161
0.5%
jan 1, 1986
30.848
-1.436
-4.45%
jan 1, 1987
32.676
+1.828
5.93%
jan 1, 1988
30.167
-2.509
-7.68%
jan 1, 1989
32.468
+2.3
7.63%
jan 1, 1990
29.268
-3.2
-9.86%
jan 1, 1991
28.536
-0.732
-2.5%
jan 1, 1992
30.358
+1.822
6.39%
jan 1, 1993
26.332
-4.025
-13.26%
jan 1, 1994
23.762
-2.57
-9.76%
jan 1, 1995
23.233
-0.529
-2.22%
jan 1, 1996
22.559
-0.675
-2.9%
jan 1, 1997
22.254
-0.305
-1.35%
jan 1, 1998
21.536
-0.717
-3.22%
jan 1, 1999
17.926
-3.61
-16.76%
jan 1, 2000
15.949
-1.977
-11.03%
jan 1, 2001
15.946
-0.003
-0.02%
jan 1, 2002
16.46
+0.514
3.22%
jan 1, 2003
14.402
-2.058
-12.5%
jan 1, 2004
17.293
+2.891
20.08%
jan 1, 2005
17.21
-0.083
-0.48%
jan 1, 2006
17.591
+0.38
2.21%
jan 1, 2007
18.408
+0.817
4.65%
jan 1, 2008
18.174
-0.235
-1.27%
jan 1, 2009
17.959
-0.214
-1.18%
jan 1, 2010
17.391
-0.569
-3.17%
jan 1, 2011
19.194
+1.804
10.37%
jan 1, 2012
20.701
+1.507
7.85%
jan 1, 2013
22.151
+1.45
7.01%
jan 1, 2014
18.99
-3.161
-14.27%
Ranking of countries by current statistics by years


Comments: