29
/
en
AIzaSyAYiBZKx7MnpbEhh9jyipgxe19OcubqV5w
April 1, 2024
191037
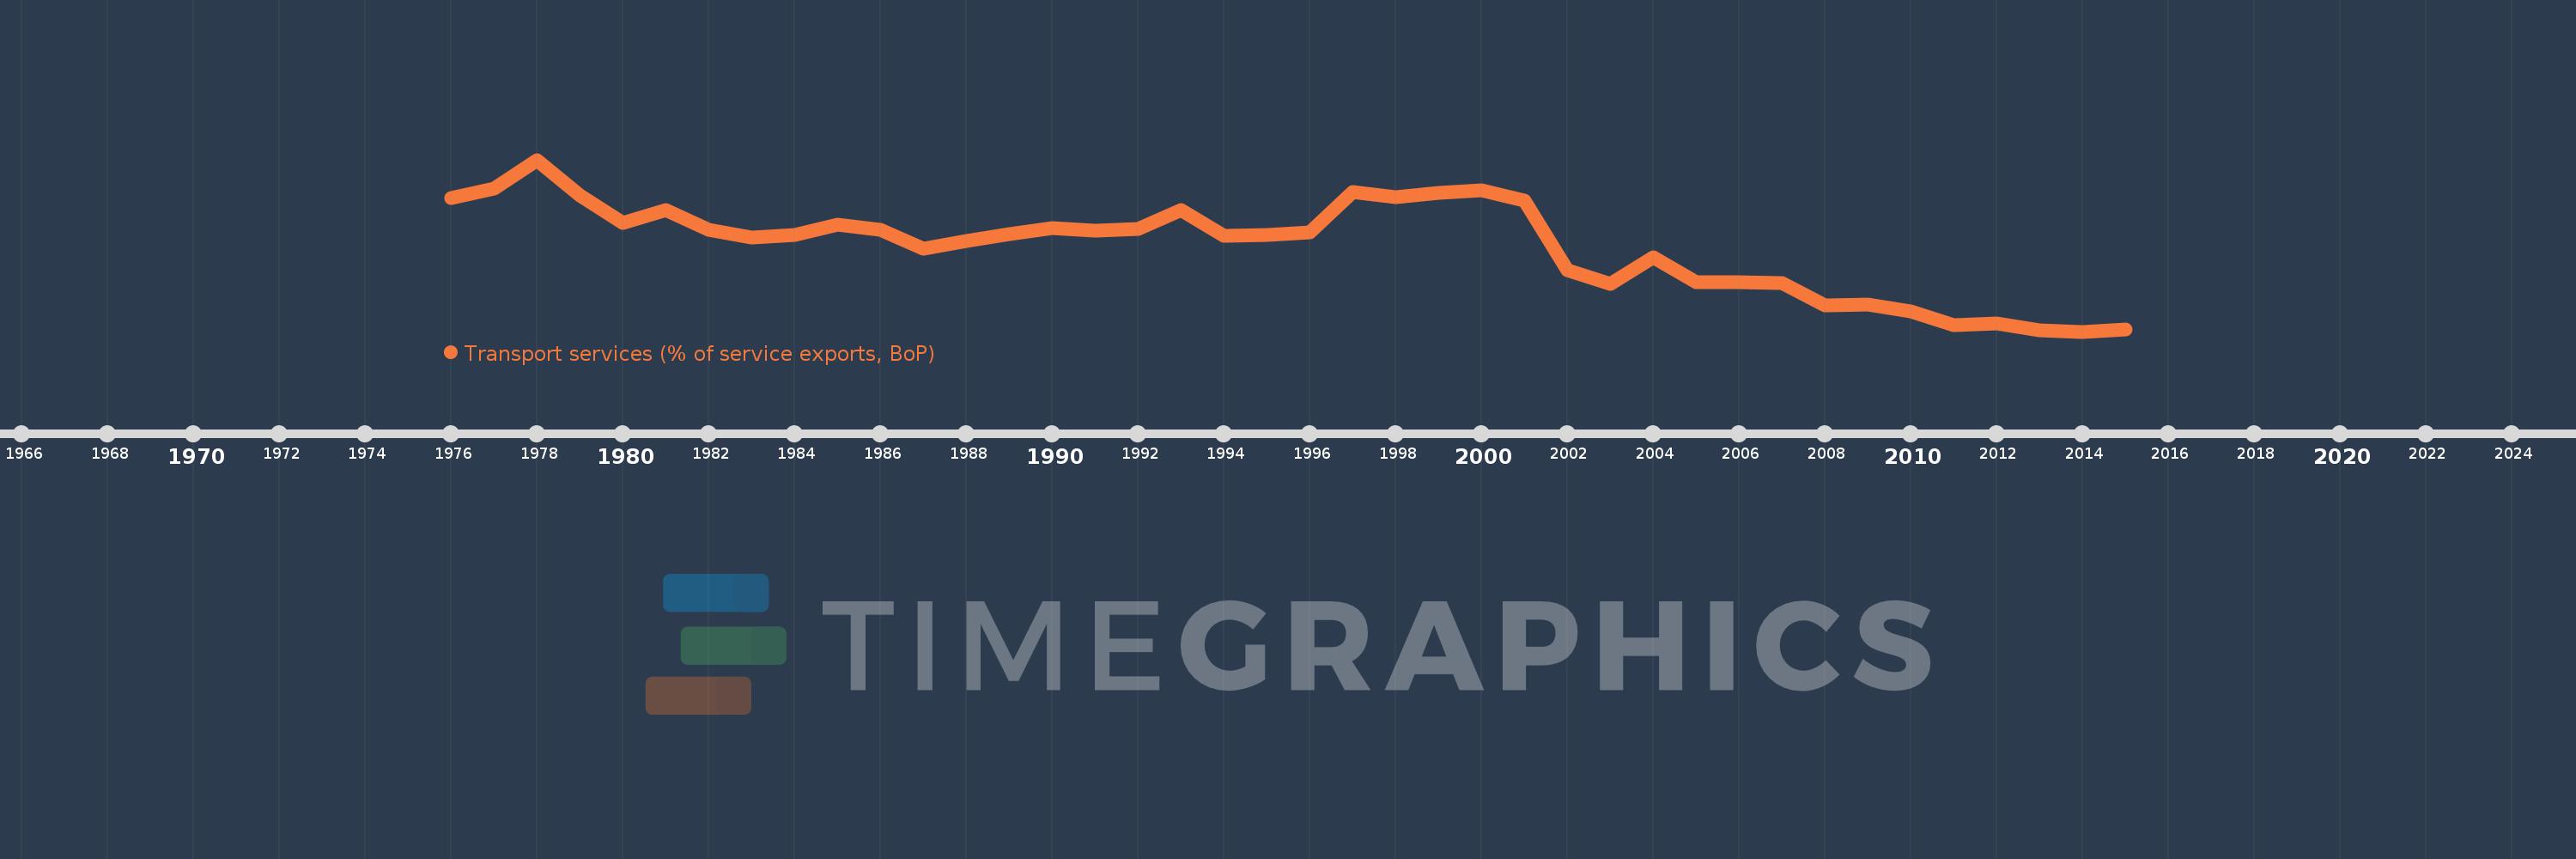
Mali
MLI
true
2
1
Transport services (% of service exports, BoP)
2015,2014,2013,2012,2011,2010,2009,2008,2007,2006,2005,2004,2003,2002,2001,2000,1999,1998,1997,1996,1995,1994,1993,1992,1991,1990,1989,1988,1987,1986,1985,1984,1983,1982,1981,1980,1979,1978,1977,1976
This statistics in other country:
AfghanistanAlbaniaAlgeriaAngolaAntigua and BarbudaArab WorldArgentinaArmeniaArubaAustraliaAustriaAzerbaijanBahamas, TheBahrainBangladeshBarbadosBelarusBelgiumBelizeBeninBermudaBhutanBoliviaBosnia and HerzegovinaBotswanaBrazilBrunei DarussalamBulgariaBurkina FasoBurundiCabo VerdeCambodiaCameroonCanadaCaribbean small statesCentral African RepublicCentral Europe and the BalticsChadChileChinaColombiaComorosCongo, Dem. Rep.Congo, Rep.Costa RicaCote d'IvoireCroatiaCuracaoCyprusCzech RepublicDenmarkDjiboutiDominicaDominican RepublicEarly-demographic dividendEast Asia & PacificEast Asia & Pacific (excluding high income)East Asia & Pacific (IDA & IBRD countries)EcuadorEgypt, Arab Rep.El SalvadorEritreaEstoniaEthiopiaEuro areaEurope & Central AsiaEurope & Central Asia (excluding high income)Europe & Central Asia (IDA & IBRD countries)European UnionFaroe IslandsFijiFinlandFragile and conflict affected situationsFranceFrench PolynesiaGabonGambia, TheGeorgiaGermanyGhanaGreeceGrenadaGuatemalaGuineaGuinea-BissauGuyanaHaitiHeavily indebted poor countries (HIPC)High incomeHondurasHong Kong SAR, ChinaHungaryIBRD onlyIcelandIDA & IBRD totalIDA onlyIDA totalIndiaIndonesiaIran, Islamic Rep.IraqIrelandIsraelItalyJamaicaJapanJordanKazakhstanKenyaKiribatiKorea, Rep.KosovoKuwaitKyrgyz RepublicLao PDRLate-demographic dividendLatin America & Caribbean Latin America & Caribbean (excluding high income)Latin America & the Caribbean (IDA & IBRD countries)LatviaLeast developed countries: UN classificationLebanonLesothoLiberiaLibyaLithuaniaLow & middle incomeLow incomeLower middle incomeLuxembourgMacao SAR, ChinaMacedonia, FYRMadagascarMalawiMalaysiaMaldivesMaliMaltaMarshall IslandsMauritaniaMauritiusMexicoMicronesia, Fed. Sts.Middle East & North AfricaMiddle East & North Africa (excluding high income)Middle East & North Africa (IDA & IBRD countries)Middle incomeMoldovaMongoliaMontenegroMoroccoMozambiqueMyanmarNamibiaNepalNetherlandsNew CaledoniaNew ZealandNicaraguaNigerNigeriaNorth AmericaNorwayOECD membersOmanOther small statesPacific island small statesPakistanPalauPanamaPapua New GuineaParaguayPeruPhilippinesPolandPortugalPost-demographic dividendPre-demographic dividendQatarRomaniaRussian FederationRwandaSamoaSao Tome and PrincipeSaudi ArabiaSenegalSerbiaSeychellesSierra LeoneSingaporeSint Maarten (Dutch part)Slovak RepublicSloveniaSmall statesSolomon IslandsSouth AfricaSouth AsiaSouth Asia (IDA & IBRD)South SudanSpainSri LankaSt. Kitts and NevisSt. LuciaSt. Vincent and the GrenadinesSub-Saharan Africa Sub-Saharan Africa (excluding high income)Sub-Saharan Africa (IDA & IBRD countries)SudanSurinameSwazilandSwedenSwitzerlandSyrian Arab RepublicTajikistanTanzaniaThailandTimor-LesteTogoTongaTrinidad and TobagoTunisiaTurkeyTuvaluUgandaUkraineUnited KingdomUnited StatesUpper middle incomeUruguayVanuatuVenezuela, RBWest Bank and GazaWorldYemen, Rep.ZambiaZimbabwe Timeline:
This timeline shows a graph from 1976 to 2015 of Mali. No data until 1975. Number of actual observations by date: 40.
Source name:
World Development Indicators
Source organization:
International Monetary Fund, Balance of Payments Statistics Yearbook and data files.
Categories, topics:
Economy & Growth, Trade
Last updated:
apr 23, 2017
Indicators value changes by year
Maximum:
43.612
jan 1, 1978
At the date of observation
Value
Absolute change
Change from previous value
jan 1, 1976
33.996
+33.996
0.0%
jan 1, 1977
36.366
+2.37
6.97%
jan 1, 1978
43.612
+7.246
19.92%
jan 1, 1979
34.524
-9.088
-20.84%
jan 1, 1980
27.68
-6.843
-19.82%
jan 1, 1981
30.943
+3.262
11.79%
jan 1, 1982
26.056
-4.887
-15.79%
jan 1, 1983
23.973
-2.083
-8.0%
jan 1, 1984
24.563
+0.59
2.46%
jan 1, 1985
27.191
+2.629
10.7%
jan 1, 1986
26.068
-1.123
-4.13%
jan 1, 1987
21.186
-4.882
-18.73%
jan 1, 1988
23.065
+1.878
8.86%
jan 1, 1989
24.903
+1.838
7.97%
jan 1, 1990
26.372
+1.469
5.9%
jan 1, 1991
25.833
-0.539
-2.04%
jan 1, 1992
26.148
+0.315
1.22%
jan 1, 1993
30.97
+4.822
18.44%
jan 1, 1994
24.445
-6.524
-21.07%
jan 1, 1995
24.589
+0.143
0.59%
jan 1, 1996
25.28
+0.691
2.81%
jan 1, 1997
35.572
+10.292
40.71%
jan 1, 1998
34.215
-1.357
-3.82%
jan 1, 1999
35.184
+0.969
2.83%
jan 1, 2000
36.019
+0.836
2.38%
jan 1, 2001
33.424
-2.596
-7.21%
jan 1, 2002
15.73
-17.694
-52.94%
jan 1, 2003
12.397
-3.332
-21.18%
jan 1, 2004
19.007
+6.61
53.31%
jan 1, 2005
12.704
-6.303
-33.16%
jan 1, 2006
12.793
+0.089
0.7%
jan 1, 2007
12.475
-0.318
-2.49%
jan 1, 2008
6.865
-5.61
-44.97%
jan 1, 2009
7.114
+0.249
3.63%
jan 1, 2010
5.512
-1.602
-22.52%
jan 1, 2011
1.884
-3.628
-65.82%
jan 1, 2012
2.471
+0.587
31.18%
jan 1, 2013
0.744
-1.727
-69.88%
jan 1, 2014
0.318
-0.426
-57.27%
jan 1, 2015
0.846
+0.528
165.9%
Ranking of countries by current statistics by years


Comments: