29
/
en
AIzaSyAYiBZKx7MnpbEhh9jyipgxe19OcubqV5w
April 1, 2024
141237
Ghana
GHA
true
2
1
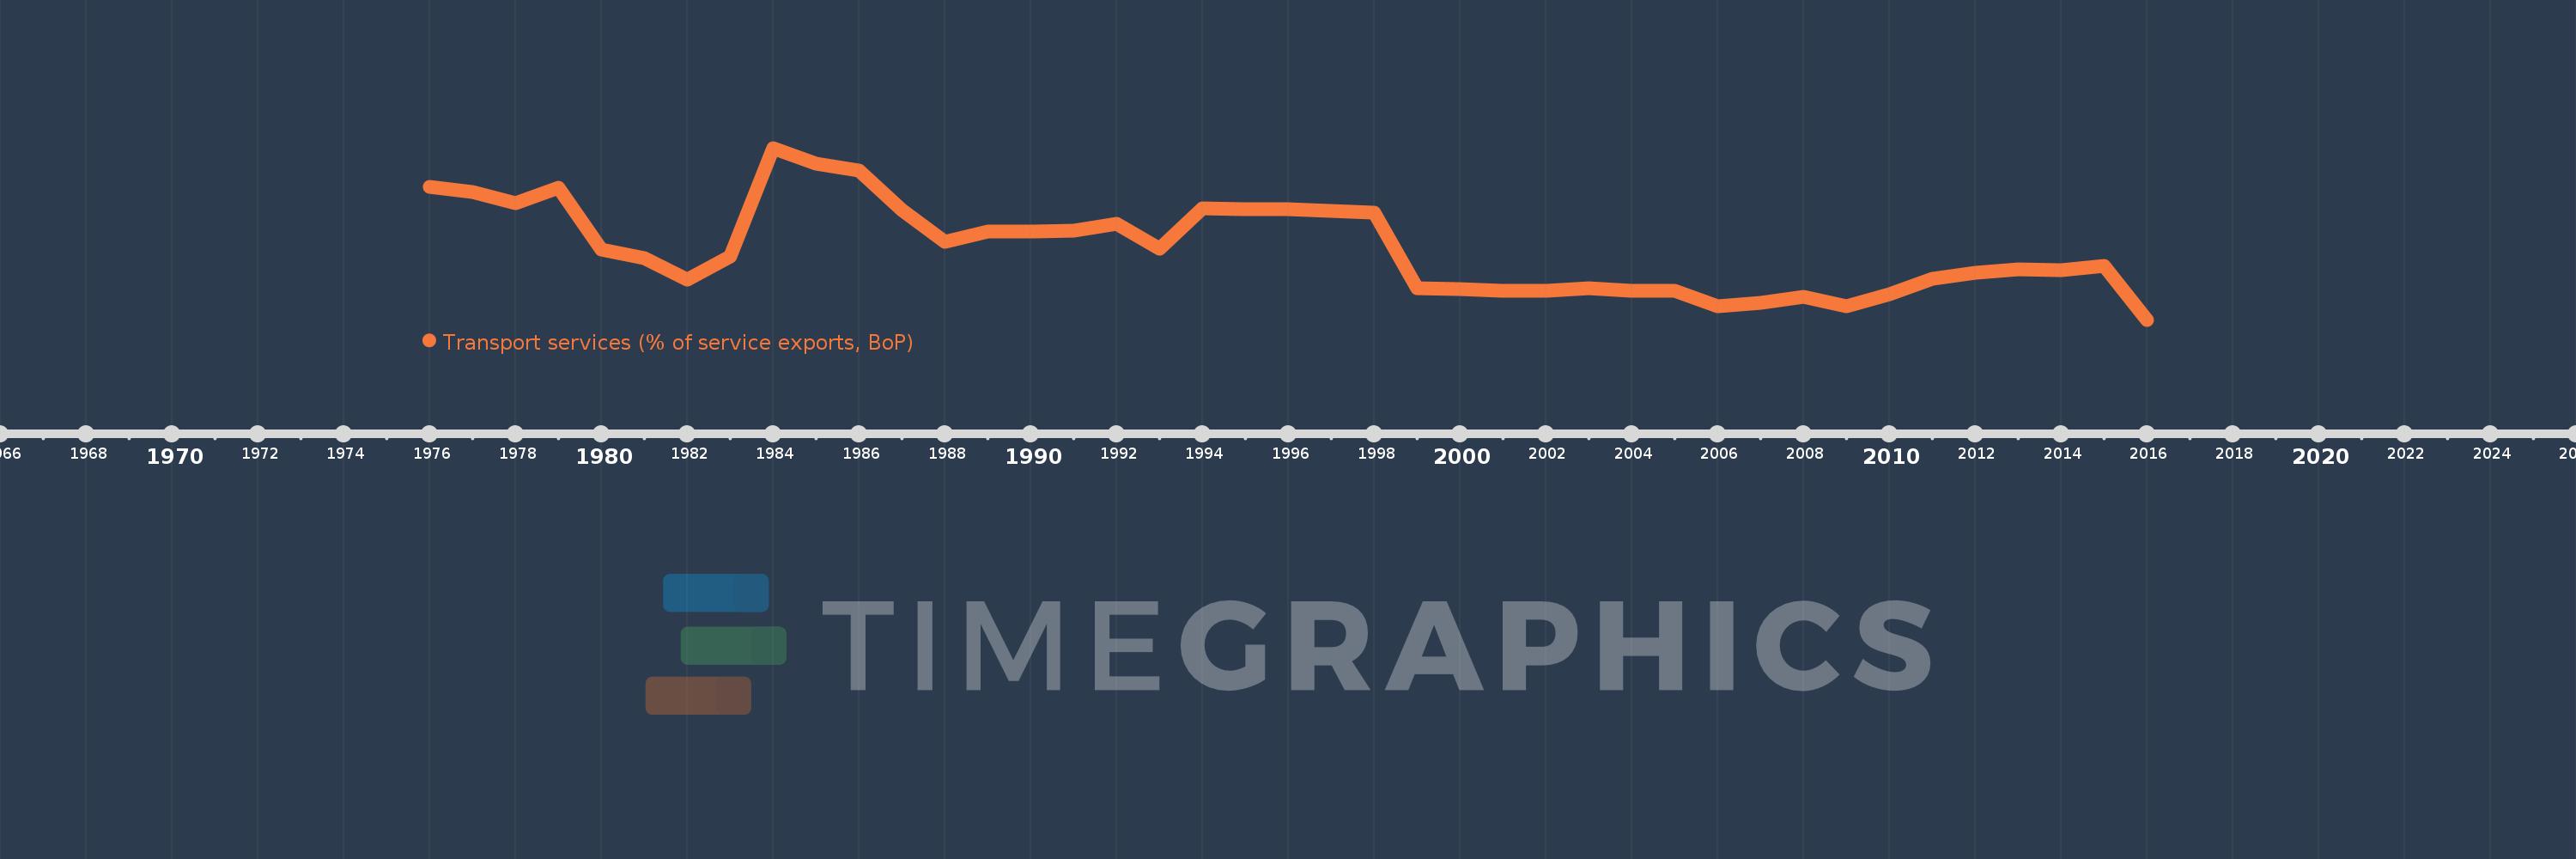
Transport services (% of service exports, BoP)
2016,2015,2014,2013,2012,2011,2010,2009,2008,2007,2006,2005,2004,2003,2002,2001,2000,1999,1998,1997,1996,1995,1994,1993,1992,1991,1990,1989,1988,1987,1986,1985,1984,1983,1982,1981,1980,1979,1978,1977,1976
This statistics in other country:
AfghanistanAlbaniaAlgeriaAngolaAntigua and BarbudaArab WorldArgentinaArmeniaArubaAustraliaAustriaAzerbaijanBahamas, TheBahrainBangladeshBarbadosBelarusBelgiumBelizeBeninBermudaBhutanBoliviaBosnia and HerzegovinaBotswanaBrazilBrunei DarussalamBulgariaBurkina FasoBurundiCabo VerdeCambodiaCameroonCanadaCaribbean small statesCentral African RepublicCentral Europe and the BalticsChadChileChinaColombiaComorosCongo, Dem. Rep.Congo, Rep.Costa RicaCote d'IvoireCroatiaCuracaoCyprusCzech RepublicDenmarkDjiboutiDominicaDominican RepublicEarly-demographic dividendEast Asia & PacificEast Asia & Pacific (excluding high income)East Asia & Pacific (IDA & IBRD countries)EcuadorEgypt, Arab Rep.El SalvadorEritreaEstoniaEthiopiaEuro areaEurope & Central AsiaEurope & Central Asia (excluding high income)Europe & Central Asia (IDA & IBRD countries)European UnionFaroe IslandsFijiFinlandFragile and conflict affected situationsFranceFrench PolynesiaGabonGambia, TheGeorgiaGermanyGhanaGreeceGrenadaGuatemalaGuineaGuinea-BissauGuyanaHaitiHeavily indebted poor countries (HIPC)High incomeHondurasHong Kong SAR, ChinaHungaryIBRD onlyIcelandIDA & IBRD totalIDA onlyIDA totalIndiaIndonesiaIran, Islamic Rep.IraqIrelandIsraelItalyJamaicaJapanJordanKazakhstanKenyaKiribatiKorea, Rep.KosovoKuwaitKyrgyz RepublicLao PDRLate-demographic dividendLatin America & Caribbean Latin America & Caribbean (excluding high income)Latin America & the Caribbean (IDA & IBRD countries)LatviaLeast developed countries: UN classificationLebanonLesothoLiberiaLibyaLithuaniaLow & middle incomeLow incomeLower middle incomeLuxembourgMacao SAR, ChinaMacedonia, FYRMadagascarMalawiMalaysiaMaldivesMaliMaltaMarshall IslandsMauritaniaMauritiusMexicoMicronesia, Fed. Sts.Middle East & North AfricaMiddle East & North Africa (excluding high income)Middle East & North Africa (IDA & IBRD countries)Middle incomeMoldovaMongoliaMontenegroMoroccoMozambiqueMyanmarNamibiaNepalNetherlandsNew CaledoniaNew ZealandNicaraguaNigerNigeriaNorth AmericaNorwayOECD membersOmanOther small statesPacific island small statesPakistanPalauPanamaPapua New GuineaParaguayPeruPhilippinesPolandPortugalPost-demographic dividendPre-demographic dividendQatarRomaniaRussian FederationRwandaSamoaSao Tome and PrincipeSaudi ArabiaSenegalSerbiaSeychellesSierra LeoneSingaporeSint Maarten (Dutch part)Slovak RepublicSloveniaSmall statesSolomon IslandsSouth AfricaSouth AsiaSouth Asia (IDA & IBRD)South SudanSpainSri LankaSt. Kitts and NevisSt. LuciaSt. Vincent and the GrenadinesSub-Saharan Africa Sub-Saharan Africa (excluding high income)Sub-Saharan Africa (IDA & IBRD countries)SudanSurinameSwazilandSwedenSwitzerlandSyrian Arab RepublicTajikistanTanzaniaThailandTimor-LesteTogoTongaTrinidad and TobagoTunisiaTurkeyTuvaluUgandaUkraineUnited KingdomUnited StatesUpper middle incomeUruguayVanuatuVenezuela, RBWest Bank and GazaWorldYemen, Rep.ZambiaZimbabwe Timeline:
This timeline shows a graph from 1976 to 2016 of Ghana. No data until 1975. Number of actual observations by date: 41.
Source name:
World Development Indicators
Source organization:
International Monetary Fund, Balance of Payments Statistics Yearbook and data files.
Categories, topics:
Economy & Growth, Trade
Last updated:
apr 23, 2017
Indicators value changes by year
Maximum:
79.843
jan 1, 1984
At the date of observation
Value
Absolute change
Change from previous value
jan 1, 1976
63.536
+63.536
0.0%
jan 1, 1977
61.33
-2.206
-3.47%
jan 1, 1978
56.658
-4.673
-7.62%
jan 1, 1979
62.905
+6.247
11.03%
jan 1, 1980
37.124
-25.781
-40.98%
jan 1, 1981
33.571
-3.553
-9.57%
jan 1, 1982
24.299
-9.272
-27.62%
jan 1, 1983
34.157
+9.858
40.57%
jan 1, 1984
79.843
+45.686
133.76%
jan 1, 1985
73.288
-6.555
-8.21%
jan 1, 1986
70.263
-3.025
-4.13%
jan 1, 1987
53.62
-16.643
-23.69%
jan 1, 1988
40.152
-13.468
-25.12%
jan 1, 1989
44.459
+4.306
10.73%
jan 1, 1990
44.747
+0.288
0.65%
jan 1, 1991
44.907
+0.161
0.36%
jan 1, 1992
48.054
+3.147
7.01%
jan 1, 1993
37.565
-10.49
-21.83%
jan 1, 1994
54.388
+16.824
44.79%
jan 1, 1995
54.102
-0.287
-0.53%
jan 1, 1996
54.137
+0.036
0.07%
jan 1, 1997
53.153
-0.984
-1.82%
jan 1, 1998
52.733
-0.42
-0.79%
jan 1, 1999
20.605
-32.128
-60.93%
jan 1, 2000
20.273
-0.332
-1.61%
jan 1, 2001
19.502
-0.771
-3.8%
jan 1, 2002
19.48
-0.023
-0.12%
jan 1, 2003
20.66
+1.18
6.06%
jan 1, 2004
19.723
-0.936
-4.53%
jan 1, 2005
19.482
-0.242
-1.22%
jan 1, 2006
13.187
-6.295
-32.31%
jan 1, 2007
14.707
+1.52
11.53%
jan 1, 2008
17.098
+2.391
16.26%
jan 1, 2009
13.301
-3.798
-22.21%
jan 1, 2010
18.239
+4.938
37.13%
jan 1, 2011
24.622
+6.383
35.0%
jan 1, 2012
27.244
+2.623
10.65%
jan 1, 2013
28.533
+1.289
4.73%
jan 1, 2014
28.376
-0.158
-0.55%
jan 1, 2015
30.128
+1.752
6.17%
jan 1, 2016
7.458
-22.67
-75.25%
Ranking of countries by current statistics by years


Comments: