29
/
en
AIzaSyAYiBZKx7MnpbEhh9jyipgxe19OcubqV5w
April 1, 2024
101678
Canada
CAN
true
2
1
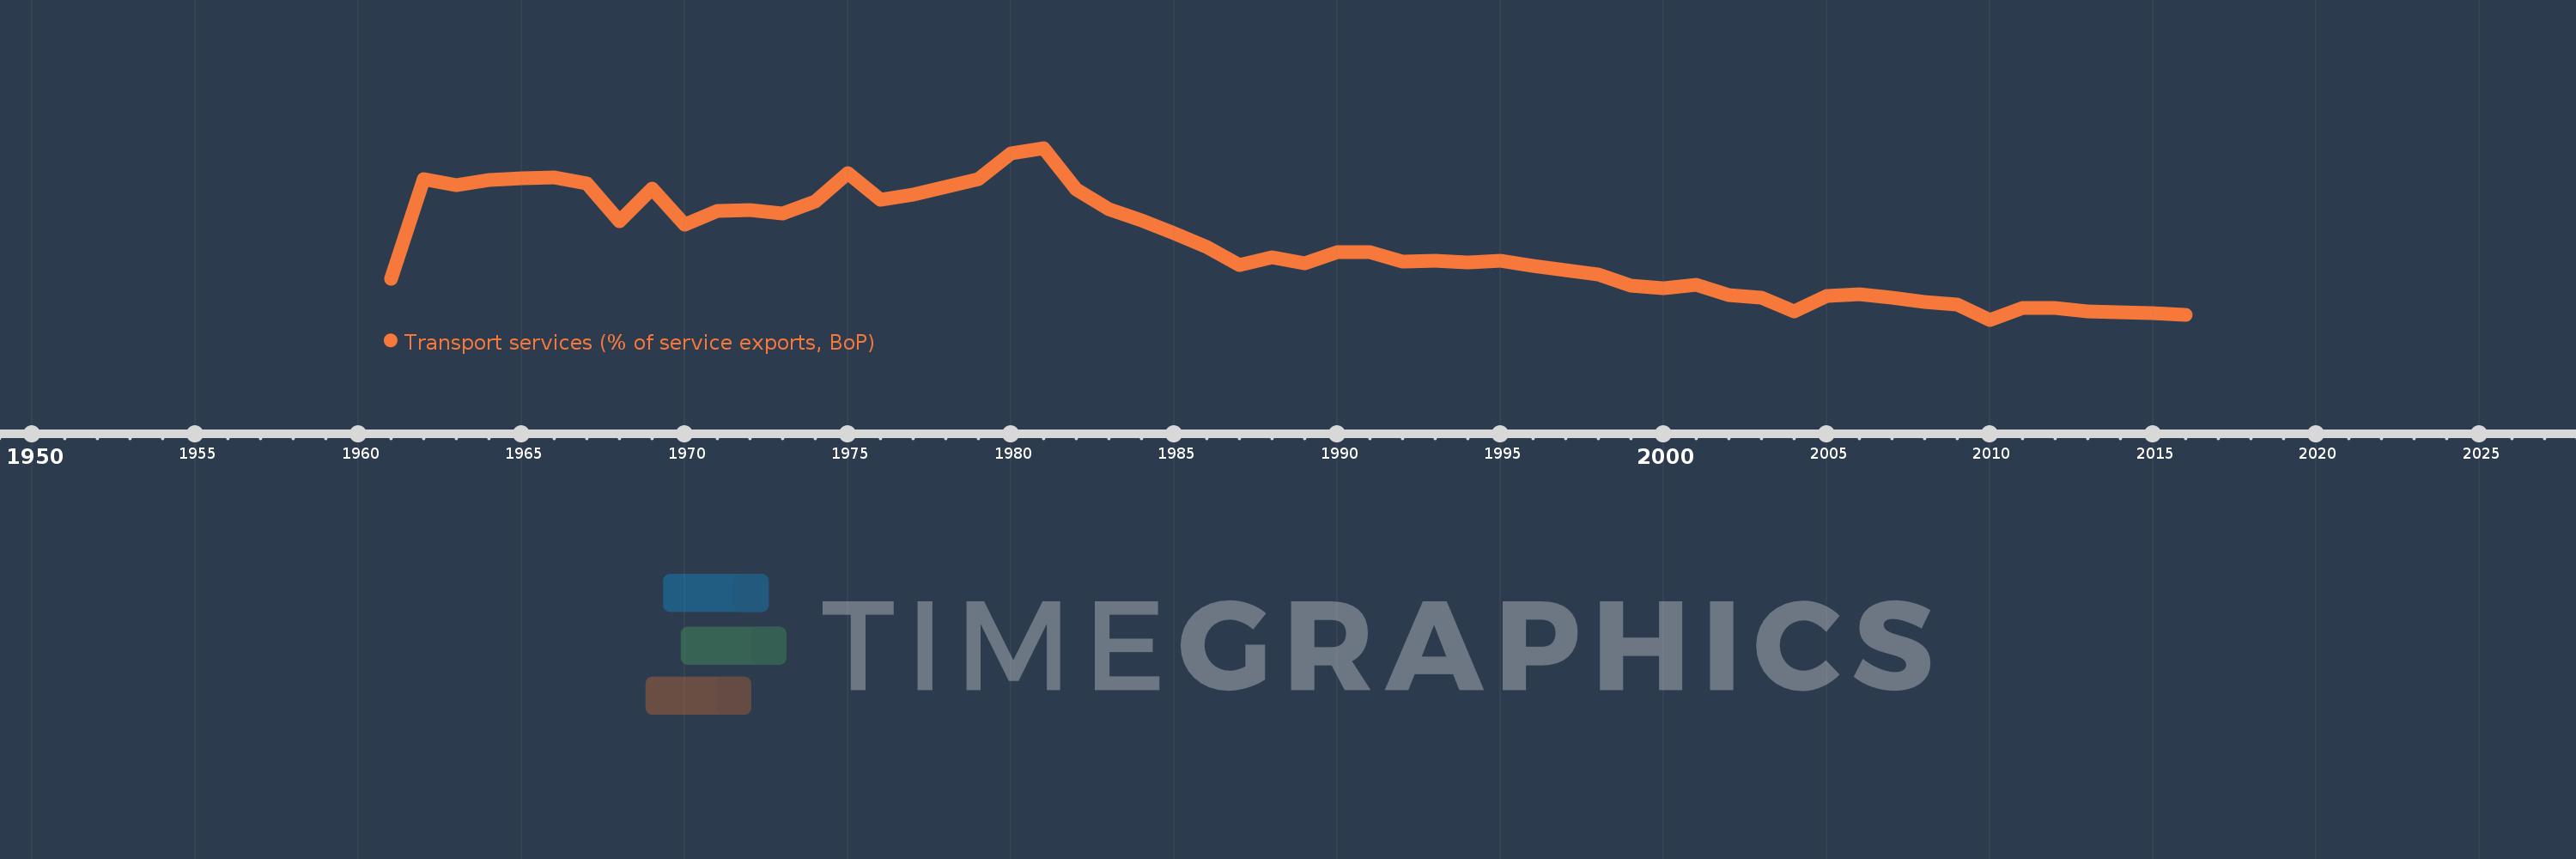
Transport services (% of service exports, BoP)
2016,2015,2014,2013,2012,2011,2010,2009,2008,2007,2006,2005,2004,2003,2002,2001,2000,1999,1998,1997,1996,1995,1994,1993,1992,1991,1990,1989,1988,1987,1986,1985,1984,1983,1982,1981,1980,1979,1978,1977,1976,1975,1974,1973,1972,1971,1970,1969,1968,1967,1966,1965,1964,1963,1962,1961
This statistics in other country:
AfghanistanAlbaniaAlgeriaAngolaAntigua and BarbudaArab WorldArgentinaArmeniaArubaAustraliaAustriaAzerbaijanBahamas, TheBahrainBangladeshBarbadosBelarusBelgiumBelizeBeninBermudaBhutanBoliviaBosnia and HerzegovinaBotswanaBrazilBrunei DarussalamBulgariaBurkina FasoBurundiCabo VerdeCambodiaCameroonCanadaCaribbean small statesCentral African RepublicCentral Europe and the BalticsChadChileChinaColombiaComorosCongo, Dem. Rep.Congo, Rep.Costa RicaCote d'IvoireCroatiaCuracaoCyprusCzech RepublicDenmarkDjiboutiDominicaDominican RepublicEarly-demographic dividendEast Asia & PacificEast Asia & Pacific (excluding high income)East Asia & Pacific (IDA & IBRD countries)EcuadorEgypt, Arab Rep.El SalvadorEritreaEstoniaEthiopiaEuro areaEurope & Central AsiaEurope & Central Asia (excluding high income)Europe & Central Asia (IDA & IBRD countries)European UnionFaroe IslandsFijiFinlandFragile and conflict affected situationsFranceFrench PolynesiaGabonGambia, TheGeorgiaGermanyGhanaGreeceGrenadaGuatemalaGuineaGuinea-BissauGuyanaHaitiHeavily indebted poor countries (HIPC)High incomeHondurasHong Kong SAR, ChinaHungaryIBRD onlyIcelandIDA & IBRD totalIDA onlyIDA totalIndiaIndonesiaIran, Islamic Rep.IraqIrelandIsraelItalyJamaicaJapanJordanKazakhstanKenyaKiribatiKorea, Rep.KosovoKuwaitKyrgyz RepublicLao PDRLate-demographic dividendLatin America & Caribbean Latin America & Caribbean (excluding high income)Latin America & the Caribbean (IDA & IBRD countries)LatviaLeast developed countries: UN classificationLebanonLesothoLiberiaLibyaLithuaniaLow & middle incomeLow incomeLower middle incomeLuxembourgMacao SAR, ChinaMacedonia, FYRMadagascarMalawiMalaysiaMaldivesMaliMaltaMarshall IslandsMauritaniaMauritiusMexicoMicronesia, Fed. Sts.Middle East & North AfricaMiddle East & North Africa (excluding high income)Middle East & North Africa (IDA & IBRD countries)Middle incomeMoldovaMongoliaMontenegroMoroccoMozambiqueMyanmarNamibiaNepalNetherlandsNew CaledoniaNew ZealandNicaraguaNigerNigeriaNorth AmericaNorwayOECD membersOmanOther small statesPacific island small statesPakistanPalauPanamaPapua New GuineaParaguayPeruPhilippinesPolandPortugalPost-demographic dividendPre-demographic dividendQatarRomaniaRussian FederationRwandaSamoaSao Tome and PrincipeSaudi ArabiaSenegalSerbiaSeychellesSierra LeoneSingaporeSint Maarten (Dutch part)Slovak RepublicSloveniaSmall statesSolomon IslandsSouth AfricaSouth AsiaSouth Asia (IDA & IBRD)South SudanSpainSri LankaSt. Kitts and NevisSt. LuciaSt. Vincent and the GrenadinesSub-Saharan Africa Sub-Saharan Africa (excluding high income)Sub-Saharan Africa (IDA & IBRD countries)SudanSurinameSwazilandSwedenSwitzerlandSyrian Arab RepublicTajikistanTanzaniaThailandTimor-LesteTogoTongaTrinidad and TobagoTunisiaTurkeyTuvaluUgandaUkraineUnited KingdomUnited StatesUpper middle incomeUruguayVanuatuVenezuela, RBWest Bank and GazaWorldYemen, Rep.ZambiaZimbabwe Timeline:
This timeline shows a graph from 1961 to 2016 of Canada. No data until 1960. Number of actual observations by date: 56.
Source name:
World Development Indicators
Source organization:
International Monetary Fund, Balance of Payments Statistics Yearbook and data files.
Categories, topics:
Economy & Growth, Trade
Last updated:
apr 23, 2017
Indicators value changes by year
Minimum:
14.815
jan 1, 2010
Maximum:
34.117
jan 1, 1981
At the date of observation
Value
Absolute change
Change from previous value
jan 1, 1961
19.401
+19.401
0.0%
jan 1, 1962
30.574
+11.174
57.6%
jan 1, 1963
29.964
-0.61
-2.0%
jan 1, 1964
30.509
+0.544
1.82%
jan 1, 1965
30.752
+0.244
0.8%
jan 1, 1966
30.77
+0.018
0.06%
jan 1, 1967
30.086
-0.684
-2.22%
jan 1, 1968
25.855
-4.23
-14.06%
jan 1, 1969
29.553
+3.698
14.3%
jan 1, 1970
25.485
-4.068
-13.77%
jan 1, 1971
27.025
+1.54
6.04%
jan 1, 1972
27.114
+0.089
0.33%
jan 1, 1973
26.707
-0.407
-1.5%
jan 1, 1974
28.107
+1.4
5.24%
jan 1, 1975
31.333
+3.226
11.48%
jan 1, 1976
28.255
-3.079
-9.83%
jan 1, 1977
28.921
+0.666
2.36%
jan 1, 1978
29.718
+0.797
2.76%
jan 1, 1979
30.566
+0.848
2.85%
jan 1, 1980
33.474
+2.908
9.52%
jan 1, 1981
34.117
+0.643
1.92%
jan 1, 1982
29.417
-4.7
-13.78%
jan 1, 1983
27.232
-2.185
-7.43%
jan 1, 1984
26.021
-1.211
-4.45%
jan 1, 1985
24.49
-1.531
-5.88%
jan 1, 1986
22.978
-1.512
-6.17%
jan 1, 1987
21.003
-1.975
-8.59%
jan 1, 1988
21.799
+0.796
3.79%
jan 1, 1989
21.121
-0.678
-3.11%
jan 1, 1990
22.421
+1.3
6.16%
jan 1, 1991
22.374
-0.047
-0.21%
jan 1, 1992
21.332
-1.042
-4.66%
jan 1, 1993
21.424
+0.092
0.43%
jan 1, 1994
21.213
-0.211
-0.98%
jan 1, 1995
21.406
+0.193
0.91%
jan 1, 1996
20.85
-0.555
-2.59%
jan 1, 1997
20.411
-0.439
-2.11%
jan 1, 1998
19.901
-0.511
-2.5%
jan 1, 1999
18.637
-1.264
-6.35%
jan 1, 2000
18.375
-0.262
-1.41%
jan 1, 2001
18.759
+0.384
2.09%
jan 1, 2002
17.614
-1.145
-6.1%
jan 1, 2003
17.271
-0.344
-1.95%
jan 1, 2004
15.741
-1.529
-8.85%
jan 1, 2005
17.457
+1.716
10.9%
jan 1, 2006
17.64
+0.183
1.05%
jan 1, 2007
17.284
-0.357
-2.02%
jan 1, 2008
16.847
-0.436
-2.52%
jan 1, 2009
16.545
-0.302
-1.79%
jan 1, 2010
14.815
-1.73
-10.46%
jan 1, 2011
16.101
+1.286
8.68%
jan 1, 2012
16.111
+0.009
0.06%
jan 1, 2013
15.724
-0.387
-2.4%
jan 1, 2014
15.631
-0.093
-0.59%
jan 1, 2015
15.606
-0.026
-0.16%
jan 1, 2016
15.35
-0.256
-1.64%
Ranking of countries by current statistics by years


Comments: