29
/
en
AIzaSyAYiBZKx7MnpbEhh9jyipgxe19OcubqV5w
April 1, 2024
53707
Other small states
OSS
false
2
1
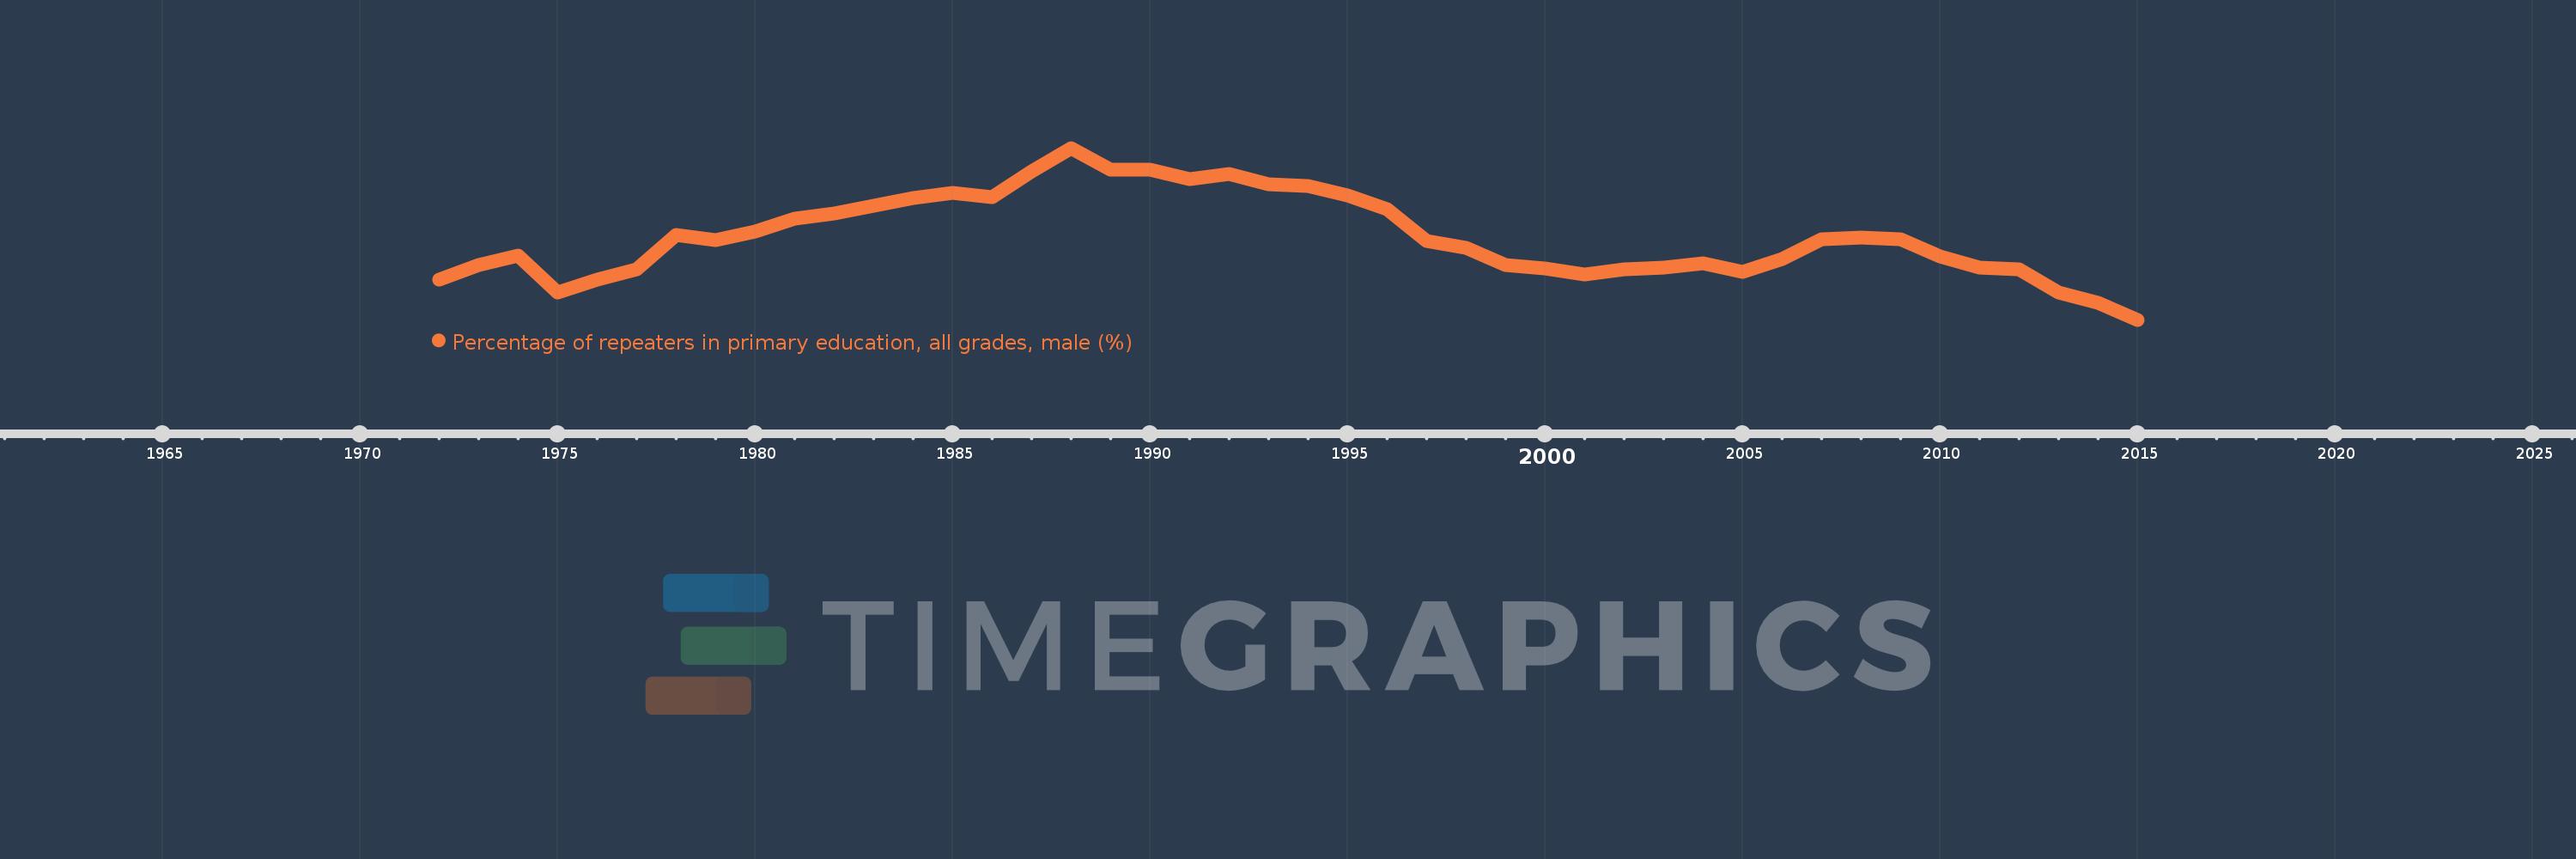
Percentage of repeaters in primary education, all grades, male (%)
2015,2014,2013,2012,2011,2010,2009,2008,2007,2006,2005,2004,2003,2002,2001,2000,1999,1998,1997,1996,1995,1994,1993,1992,1991,1990,1989,1988,1987,1986,1985,1984,1983,1982,1981,1980,1979,1978,1977,1976,1975,1974,1973,1972
This statistics in other country:
AfghanistanAlbaniaAlgeriaAndorraAngolaAntigua and BarbudaArab WorldArgentinaArmeniaArubaAustriaAzerbaijanBahamas, TheBahrainBangladeshBelarusBelgiumBelizeBeninBermudaBhutanBoliviaBosnia and HerzegovinaBotswanaBrazilBritish Virgin IslandsBrunei DarussalamBulgariaBurkina FasoBurundiCabo VerdeCambodiaCameroonCanadaCaribbean small statesCayman IslandsCentral African RepublicCentral Europe and the BalticsChadChileChinaColombiaComorosCongo, Dem. Rep.Congo, Rep.Costa RicaCote d'IvoireCroatiaCubaCyprusCzech RepublicDenmarkDjiboutiDominicaDominican RepublicEarly-demographic dividendEast Asia & PacificEast Asia & Pacific (excluding high income)East Asia & Pacific (IDA & IBRD countries)EcuadorEgypt, Arab Rep.El SalvadorEquatorial GuineaEritreaEstoniaEthiopiaEuro areaEurope & Central AsiaEurope & Central Asia (excluding high income)Europe & Central Asia (IDA & IBRD countries)European UnionFijiFinlandFragile and conflict affected situationsFranceGabonGambia, TheGeorgiaGermanyGhanaGreeceGrenadaGuatemalaGuineaGuinea-BissauGuyanaHaitiHeavily indebted poor countries (HIPC)High incomeHondurasHong Kong SAR, ChinaHungaryIBRD onlyIcelandIDA & IBRD totalIDA blendIDA onlyIDA totalIndiaIndonesiaIran, Islamic Rep.IraqIrelandIsraelItalyJamaicaJapanJordanKazakhstanKenyaKiribatiKorea, Rep.KuwaitKyrgyz RepublicLao PDRLate-demographic dividendLatin America & Caribbean Latin America & Caribbean (excluding high income)Latin America & the Caribbean (IDA & IBRD countries)LatviaLeast developed countries: UN classificationLebanonLesothoLiberiaLibyaLiechtensteinLithuaniaLow & middle incomeLow incomeLower middle incomeLuxembourgMacao SAR, ChinaMacedonia, FYRMadagascarMalawiMalaysiaMaldivesMaliMaltaMauritaniaMauritiusMexicoMiddle East & North AfricaMiddle East & North Africa (excluding high income)Middle East & North Africa (IDA & IBRD countries)Middle incomeMoldovaMonacoMongoliaMontenegroMoroccoMozambiqueMyanmarNamibiaNauruNepalNetherlandsNew ZealandNicaraguaNigerNorwayOECD membersOmanOther small statesPacific island small statesPakistanPalauPanamaPapua New GuineaParaguayPeruPhilippinesPolandPortugalPost-demographic dividendPre-demographic dividendQatarRomaniaRussian FederationRwandaSamoaSan MarinoSao Tome and PrincipeSaudi ArabiaSenegalSerbiaSeychellesSierra LeoneSingaporeSint Maarten (Dutch part)Slovak RepublicSloveniaSmall statesSolomon IslandsSomaliaSouth AfricaSouth AsiaSouth Asia (IDA & IBRD)South SudanSpainSri LankaSt. Kitts and NevisSt. LuciaSt. Vincent and the GrenadinesSub-Saharan Africa Sub-Saharan Africa (excluding high income)Sub-Saharan Africa (IDA & IBRD countries)SudanSurinameSwazilandSwedenSwitzerlandSyrian Arab RepublicTajikistanTanzaniaThailandTimor-LesteTogoTongaTrinidad and TobagoTunisiaTurkeyTurks and Caicos IslandsTuvaluUgandaUkraineUnited Arab EmiratesUnited KingdomUpper middle incomeUruguayUzbekistanVanuatuVenezuela, RBVietnamWest Bank and GazaWorldYemen, Rep.ZambiaZimbabwe Timeline:
This timeline shows a graph from 1972 to 2015 of Other small states. No data until 1971. Number of actual observations by date: 44.
Source name:
World Development Indicators
Source organization:
UNESCO Institute for Statistics
Categories, topics:
Education, Gender
Last updated:
apr 23, 2017
Indicators value changes by year
Minimum:
12.585
jan 1, 2015
Maximum:
18.779
jan 1, 1988
At the date of observation
Value
Absolute change
Change from previous value
jan 1, 1972
14.032
+14.032
0.0%
jan 1, 1973
14.57
+0.539
3.84%
jan 1, 1974
14.908
+0.337
2.32%
jan 1, 1975
13.571
-1.337
-8.97%
jan 1, 1976
14.039
+0.468
3.45%
jan 1, 1977
14.402
+0.363
2.58%
jan 1, 1978
15.644
+1.242
8.62%
jan 1, 1979
15.463
-0.18
-1.15%
jan 1, 1980
15.778
+0.314
2.03%
jan 1, 1981
16.236
+0.458
2.91%
jan 1, 1982
16.431
+0.195
1.2%
jan 1, 1983
16.696
+0.265
1.62%
jan 1, 1984
16.96
+0.264
1.58%
jan 1, 1985
17.174
+0.214
1.26%
jan 1, 1986
17.015
-0.16
-0.93%
jan 1, 1987
17.934
+0.92
5.4%
jan 1, 1988
18.779
+0.845
4.71%
jan 1, 1989
17.989
-0.79
-4.21%
jan 1, 1990
17.996
+0.007
0.04%
jan 1, 1991
17.667
-0.329
-1.83%
jan 1, 1992
17.856
+0.189
1.07%
jan 1, 1993
17.482
-0.374
-2.09%
jan 1, 1994
17.407
-0.075
-0.43%
jan 1, 1995
17.065
-0.342
-1.96%
jan 1, 1996
16.573
-0.492
-2.88%
jan 1, 1997
15.411
-1.162
-7.01%
jan 1, 1998
15.166
-0.245
-1.59%
jan 1, 1999
14.564
-0.602
-3.97%
jan 1, 2000
14.419
-0.145
-0.99%
jan 1, 2001
14.232
-0.188
-1.3%
jan 1, 2002
14.393
+0.161
1.13%
jan 1, 2003
14.454
+0.061
0.42%
jan 1, 2004
14.629
+0.175
1.21%
jan 1, 2005
14.304
-0.325
-2.22%
jan 1, 2006
14.764
+0.46
3.21%
jan 1, 2007
15.481
+0.717
4.86%
jan 1, 2008
15.541
+0.06
0.39%
jan 1, 2009
15.488
-0.053
-0.34%
jan 1, 2010
14.868
-0.619
-4.0%
jan 1, 2011
14.466
-0.403
-2.71%
jan 1, 2012
14.395
-0.071
-0.49%
jan 1, 2013
13.577
-0.818
-5.69%
jan 1, 2014
13.186
-0.39
-2.88%
jan 1, 2015
12.585
-0.602
-4.56%
Ranking of countries by current statistics by years


Comments: