29
/
en
AIzaSyAYiBZKx7MnpbEhh9jyipgxe19OcubqV5w
April 1, 2024
26801
Early-demographic dividend
EAR
false
2
1
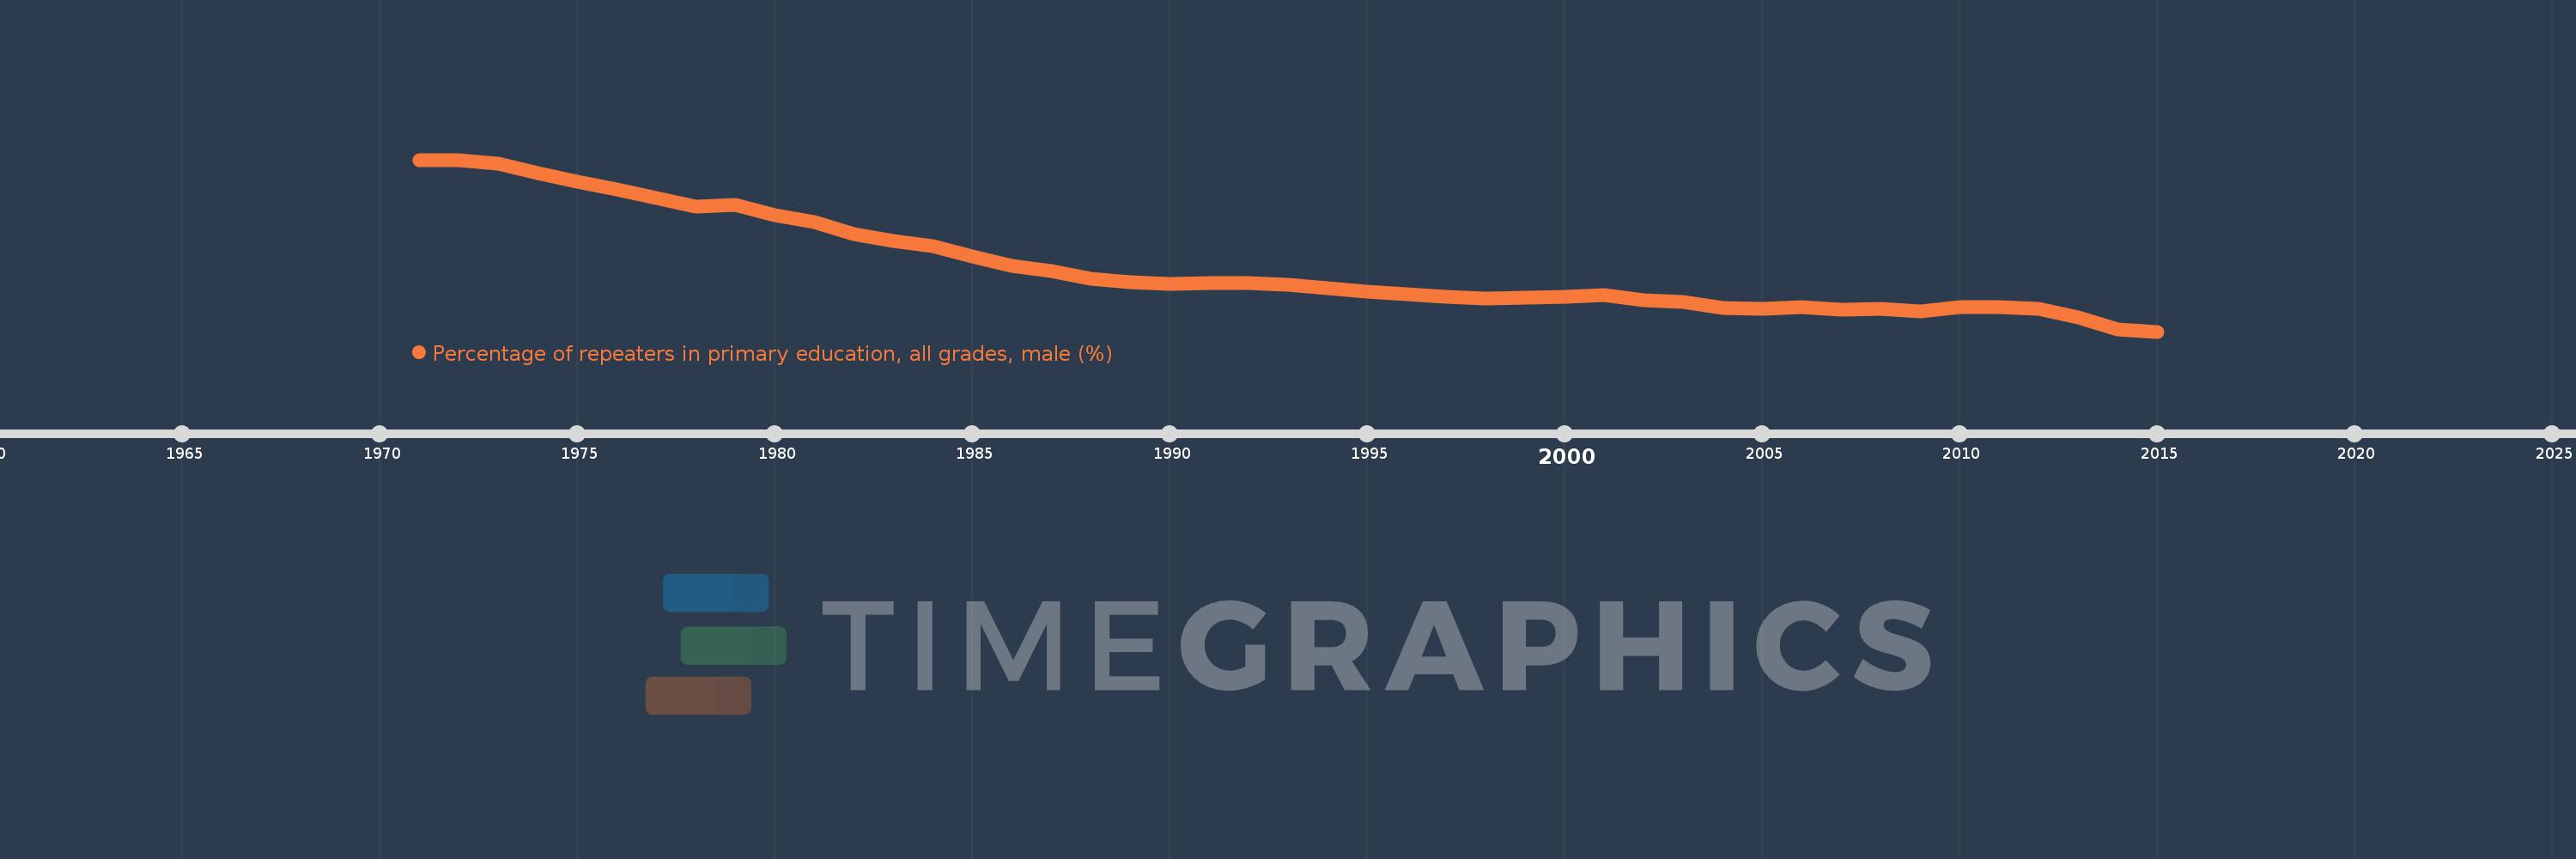
Percentage of repeaters in primary education, all grades, male (%)
2015,2014,2013,2012,2011,2010,2009,2008,2007,2006,2005,2004,2003,2002,2001,2000,1999,1998,1997,1996,1995,1994,1993,1992,1991,1990,1989,1988,1987,1986,1985,1984,1983,1982,1981,1980,1979,1978,1977,1976,1975,1974,1973,1972,1971
This statistics in other country:
AfghanistanAlbaniaAlgeriaAndorraAngolaAntigua and BarbudaArab WorldArgentinaArmeniaArubaAustriaAzerbaijanBahamas, TheBahrainBangladeshBelarusBelgiumBelizeBeninBermudaBhutanBoliviaBosnia and HerzegovinaBotswanaBrazilBritish Virgin IslandsBrunei DarussalamBulgariaBurkina FasoBurundiCabo VerdeCambodiaCameroonCanadaCaribbean small statesCayman IslandsCentral African RepublicCentral Europe and the BalticsChadChileChinaColombiaComorosCongo, Dem. Rep.Congo, Rep.Costa RicaCote d'IvoireCroatiaCubaCyprusCzech RepublicDenmarkDjiboutiDominicaDominican RepublicEarly-demographic dividendEast Asia & PacificEast Asia & Pacific (excluding high income)East Asia & Pacific (IDA & IBRD countries)EcuadorEgypt, Arab Rep.El SalvadorEquatorial GuineaEritreaEstoniaEthiopiaEuro areaEurope & Central AsiaEurope & Central Asia (excluding high income)Europe & Central Asia (IDA & IBRD countries)European UnionFijiFinlandFragile and conflict affected situationsFranceGabonGambia, TheGeorgiaGermanyGhanaGreeceGrenadaGuatemalaGuineaGuinea-BissauGuyanaHaitiHeavily indebted poor countries (HIPC)High incomeHondurasHong Kong SAR, ChinaHungaryIBRD onlyIcelandIDA & IBRD totalIDA blendIDA onlyIDA totalIndiaIndonesiaIran, Islamic Rep.IraqIrelandIsraelItalyJamaicaJapanJordanKazakhstanKenyaKiribatiKorea, Rep.KuwaitKyrgyz RepublicLao PDRLate-demographic dividendLatin America & Caribbean Latin America & Caribbean (excluding high income)Latin America & the Caribbean (IDA & IBRD countries)LatviaLeast developed countries: UN classificationLebanonLesothoLiberiaLibyaLiechtensteinLithuaniaLow & middle incomeLow incomeLower middle incomeLuxembourgMacao SAR, ChinaMacedonia, FYRMadagascarMalawiMalaysiaMaldivesMaliMaltaMauritaniaMauritiusMexicoMiddle East & North AfricaMiddle East & North Africa (excluding high income)Middle East & North Africa (IDA & IBRD countries)Middle incomeMoldovaMonacoMongoliaMontenegroMoroccoMozambiqueMyanmarNamibiaNauruNepalNetherlandsNew ZealandNicaraguaNigerNorwayOECD membersOmanOther small statesPacific island small statesPakistanPalauPanamaPapua New GuineaParaguayPeruPhilippinesPolandPortugalPost-demographic dividendPre-demographic dividendQatarRomaniaRussian FederationRwandaSamoaSan MarinoSao Tome and PrincipeSaudi ArabiaSenegalSerbiaSeychellesSierra LeoneSingaporeSint Maarten (Dutch part)Slovak RepublicSloveniaSmall statesSolomon IslandsSomaliaSouth AfricaSouth AsiaSouth Asia (IDA & IBRD)South SudanSpainSri LankaSt. Kitts and NevisSt. LuciaSt. Vincent and the GrenadinesSub-Saharan Africa Sub-Saharan Africa (excluding high income)Sub-Saharan Africa (IDA & IBRD countries)SudanSurinameSwazilandSwedenSwitzerlandSyrian Arab RepublicTajikistanTanzaniaThailandTimor-LesteTogoTongaTrinidad and TobagoTunisiaTurkeyTurks and Caicos IslandsTuvaluUgandaUkraineUnited Arab EmiratesUnited KingdomUpper middle incomeUruguayUzbekistanVanuatuVenezuela, RBVietnamWest Bank and GazaWorldYemen, Rep.ZambiaZimbabwe Timeline:
This timeline shows a graph from 1971 to 2015 of Early-demographic dividend. No data until 1970. Number of actual observations by date: 45.
Source name:
World Development Indicators
Source organization:
UNESCO Institute for Statistics
Categories, topics:
Education, Gender
Last updated:
apr 23, 2017
Indicators value changes by year
Maximum:
15.382
jan 1, 1971
At the date of observation
Value
Absolute change
Change from previous value
jan 1, 1971
15.382
+15.382
0.0%
jan 1, 1972
15.365
-0.017
-0.11%
jan 1, 1973
15.106
-0.259
-1.69%
jan 1, 1974
14.5
-0.606
-4.01%
jan 1, 1975
13.88
-0.62
-4.28%
jan 1, 1976
13.353
-0.527
-3.8%
jan 1, 1977
12.745
-0.608
-4.56%
jan 1, 1978
12.197
-0.548
-4.3%
jan 1, 1979
12.272
+0.076
0.62%
jan 1, 1980
11.617
-0.656
-5.34%
jan 1, 1981
11.13
-0.486
-4.18%
jan 1, 1982
10.31
-0.82
-7.37%
jan 1, 1983
9.841
-0.47
-4.56%
jan 1, 1984
9.451
-0.39
-3.96%
jan 1, 1985
8.75
-0.701
-7.42%
jan 1, 1986
8.111
-0.639
-7.3%
jan 1, 1987
7.787
-0.325
-4.0%
jan 1, 1988
7.22
-0.566
-7.27%
jan 1, 1989
6.997
-0.224
-3.1%
jan 1, 1990
6.867
-0.129
-1.85%
jan 1, 1991
6.971
+0.103
1.51%
jan 1, 1992
6.967
-0.003
-0.04%
jan 1, 1993
6.835
-0.132
-1.9%
jan 1, 1994
6.601
-0.234
-3.43%
jan 1, 1995
6.343
-0.258
-3.9%
jan 1, 1996
6.152
-0.191
-3.01%
jan 1, 1997
5.991
-0.161
-2.62%
jan 1, 1998
5.881
-0.11
-1.84%
jan 1, 1999
5.933
+0.052
0.88%
jan 1, 2000
6.003
+0.07
1.19%
jan 1, 2001
6.149
+0.146
2.43%
jan 1, 2002
5.739
-0.41
-6.67%
jan 1, 2003
5.676
-0.063
-1.1%
jan 1, 2004
5.21
-0.466
-8.21%
jan 1, 2005
5.157
-0.053
-1.02%
jan 1, 2006
5.312
+0.155
3.01%
jan 1, 2007
5.15
-0.162
-3.04%
jan 1, 2008
5.175
+0.024
0.47%
jan 1, 2009
5.023
-0.152
-2.93%
jan 1, 2010
5.29
+0.267
5.32%
jan 1, 2011
5.291
+0.001
0.01%
jan 1, 2012
5.208
-0.083
-1.57%
jan 1, 2013
4.595
-0.612
-11.76%
jan 1, 2014
3.752
-0.843
-18.35%
jan 1, 2015
3.622
-0.131
-3.48%
Ranking of countries by current statistics by years


Comments: