29
/
en
AIzaSyAYiBZKx7MnpbEhh9jyipgxe19OcubqV5w
April 1, 2024
193453
Mauritania
MRT
true
2
1
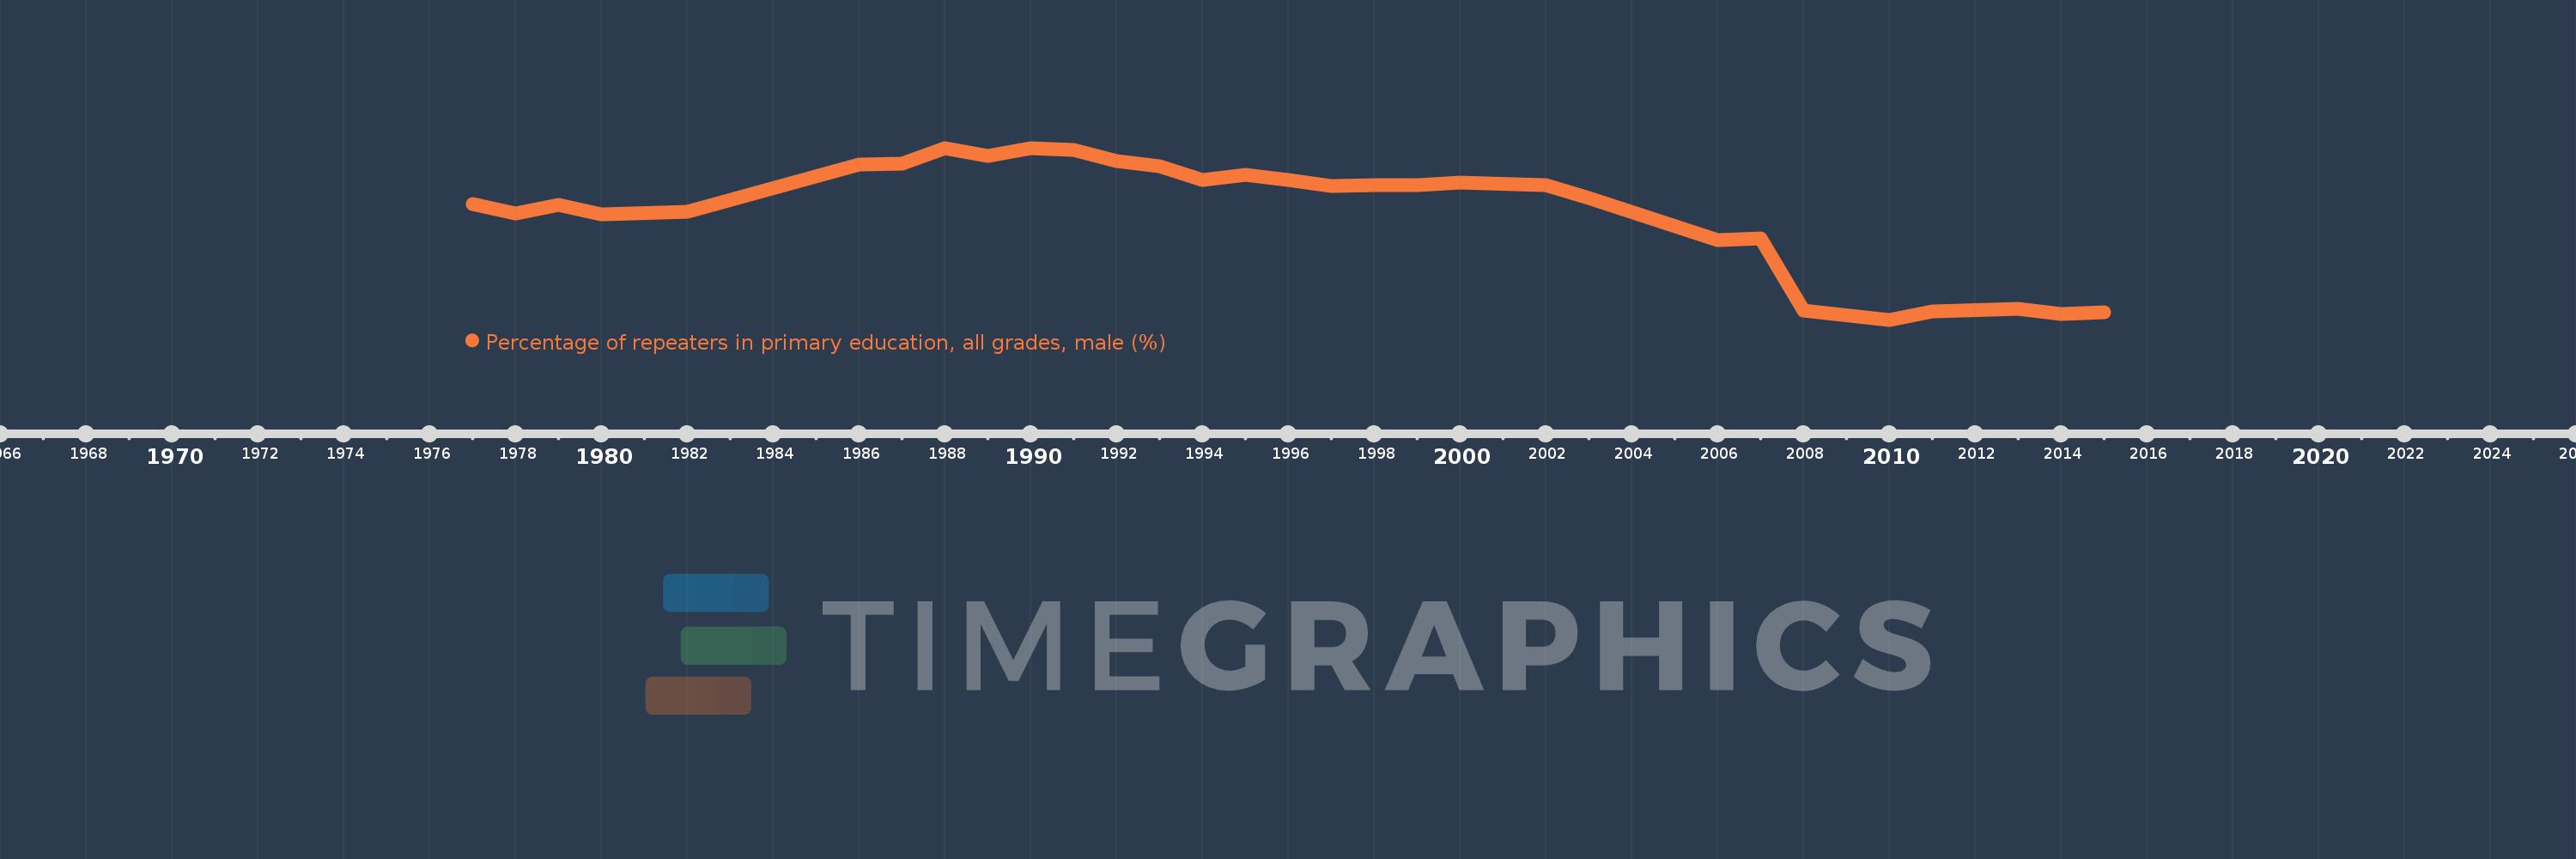
Percentage of repeaters in primary education, all grades, male (%)
2015,2014,2013,2011,2010,2008,2007,2006,2003,2002,2000,1999,1998,1997,1996,1995,1994,1993,1992,1991,1990,1989,1988,1987,1986,1982,1980,1979,1978,1977
This statistics in other country:
AfghanistanAlbaniaAlgeriaAndorraAngolaAntigua and BarbudaArab WorldArgentinaArmeniaArubaAustriaAzerbaijanBahamas, TheBahrainBangladeshBelarusBelgiumBelizeBeninBermudaBhutanBoliviaBosnia and HerzegovinaBotswanaBrazilBritish Virgin IslandsBrunei DarussalamBulgariaBurkina FasoBurundiCabo VerdeCambodiaCameroonCanadaCaribbean small statesCayman IslandsCentral African RepublicCentral Europe and the BalticsChadChileChinaColombiaComorosCongo, Dem. Rep.Congo, Rep.Costa RicaCote d'IvoireCroatiaCubaCyprusCzech RepublicDenmarkDjiboutiDominicaDominican RepublicEarly-demographic dividendEast Asia & PacificEast Asia & Pacific (excluding high income)East Asia & Pacific (IDA & IBRD countries)EcuadorEgypt, Arab Rep.El SalvadorEquatorial GuineaEritreaEstoniaEthiopiaEuro areaEurope & Central AsiaEurope & Central Asia (excluding high income)Europe & Central Asia (IDA & IBRD countries)European UnionFijiFinlandFragile and conflict affected situationsFranceGabonGambia, TheGeorgiaGermanyGhanaGreeceGrenadaGuatemalaGuineaGuinea-BissauGuyanaHaitiHeavily indebted poor countries (HIPC)High incomeHondurasHong Kong SAR, ChinaHungaryIBRD onlyIcelandIDA & IBRD totalIDA blendIDA onlyIDA totalIndiaIndonesiaIran, Islamic Rep.IraqIrelandIsraelItalyJamaicaJapanJordanKazakhstanKenyaKiribatiKorea, Rep.KuwaitKyrgyz RepublicLao PDRLate-demographic dividendLatin America & Caribbean Latin America & Caribbean (excluding high income)Latin America & the Caribbean (IDA & IBRD countries)LatviaLeast developed countries: UN classificationLebanonLesothoLiberiaLibyaLiechtensteinLithuaniaLow & middle incomeLow incomeLower middle incomeLuxembourgMacao SAR, ChinaMacedonia, FYRMadagascarMalawiMalaysiaMaldivesMaliMaltaMauritaniaMauritiusMexicoMiddle East & North AfricaMiddle East & North Africa (excluding high income)Middle East & North Africa (IDA & IBRD countries)Middle incomeMoldovaMonacoMongoliaMontenegroMoroccoMozambiqueMyanmarNamibiaNauruNepalNetherlandsNew ZealandNicaraguaNigerNorwayOECD membersOmanOther small statesPacific island small statesPakistanPalauPanamaPapua New GuineaParaguayPeruPhilippinesPolandPortugalPost-demographic dividendPre-demographic dividendQatarRomaniaRussian FederationRwandaSamoaSan MarinoSao Tome and PrincipeSaudi ArabiaSenegalSerbiaSeychellesSierra LeoneSingaporeSint Maarten (Dutch part)Slovak RepublicSloveniaSmall statesSolomon IslandsSomaliaSouth AfricaSouth AsiaSouth Asia (IDA & IBRD)South SudanSpainSri LankaSt. Kitts and NevisSt. LuciaSt. Vincent and the GrenadinesSub-Saharan Africa Sub-Saharan Africa (excluding high income)Sub-Saharan Africa (IDA & IBRD countries)SudanSurinameSwazilandSwedenSwitzerlandSyrian Arab RepublicTajikistanTanzaniaThailandTimor-LesteTogoTongaTrinidad and TobagoTunisiaTurkeyTurks and Caicos IslandsTuvaluUgandaUkraineUnited Arab EmiratesUnited KingdomUpper middle incomeUruguayUzbekistanVanuatuVenezuela, RBVietnamWest Bank and GazaWorldYemen, Rep.ZambiaZimbabwe Timeline:
This timeline shows a graph from 1977 to 2015 of Mauritania. No data until 1976. Number of actual observations by date: 30.
Source name:
World Development Indicators
Source organization:
UNESCO Institute for Statistics
Categories, topics:
Education, Gender
Last updated:
apr 23, 2017
Indicators value changes by year
Maximum:
18.411
jan 1, 1990
At the date of observation
Value
Absolute change
Change from previous value
jan 1, 1977
13.242
+13.242
0.0%
jan 1, 1978
12.39
-0.852
-6.43%
jan 1, 1979
13.216
+0.826
6.67%
jan 1, 1980
12.344
-0.872
-6.6%
jan 1, 1982
12.519
+0.174
1.41%
jan 1, 1986
16.898
+4.379
34.98%
jan 1, 1987
16.99
+0.092
0.54%
jan 1, 1988
18.409
+1.419
8.35%
jan 1, 1989
17.672
-0.737
-4.0%
jan 1, 1990
18.411
+0.739
4.18%
jan 1, 1991
18.207
-0.204
-1.11%
jan 1, 1992
17.208
-0.999
-5.48%
jan 1, 1993
16.739
-0.469
-2.72%
jan 1, 1994
15.48
-1.259
-7.52%
jan 1, 1995
15.922
+0.441
2.85%
jan 1, 1996
15.505
-0.416
-2.61%
jan 1, 1997
14.902
-0.603
-3.89%
jan 1, 1998
14.968
+0.066
0.44%
jan 1, 1999
15.007
+0.04
0.26%
jan 1, 2000
15.267
+0.259
1.73%
jan 1, 2002
14.983
-0.284
-1.86%
jan 1, 2003
13.818
-1.165
-7.77%
jan 1, 2006
9.942
-3.876
-28.05%
jan 1, 2007
10.089
+0.147
1.48%
jan 1, 2008
3.436
-6.652
-65.94%
jan 1, 2010
2.631
-0.806
-23.45%
jan 1, 2011
3.361
+0.731
27.78%
jan 1, 2013
3.635
+0.273
8.13%
jan 1, 2014
3.196
-0.438
-12.06%
jan 1, 2015
3.351
+0.154
4.83%
Ranking of countries by current statistics by years


Comments: