29
/
en
AIzaSyAYiBZKx7MnpbEhh9jyipgxe19OcubqV5w
April 1, 2024
25220
Caribbean small states
CSS
false
2
1
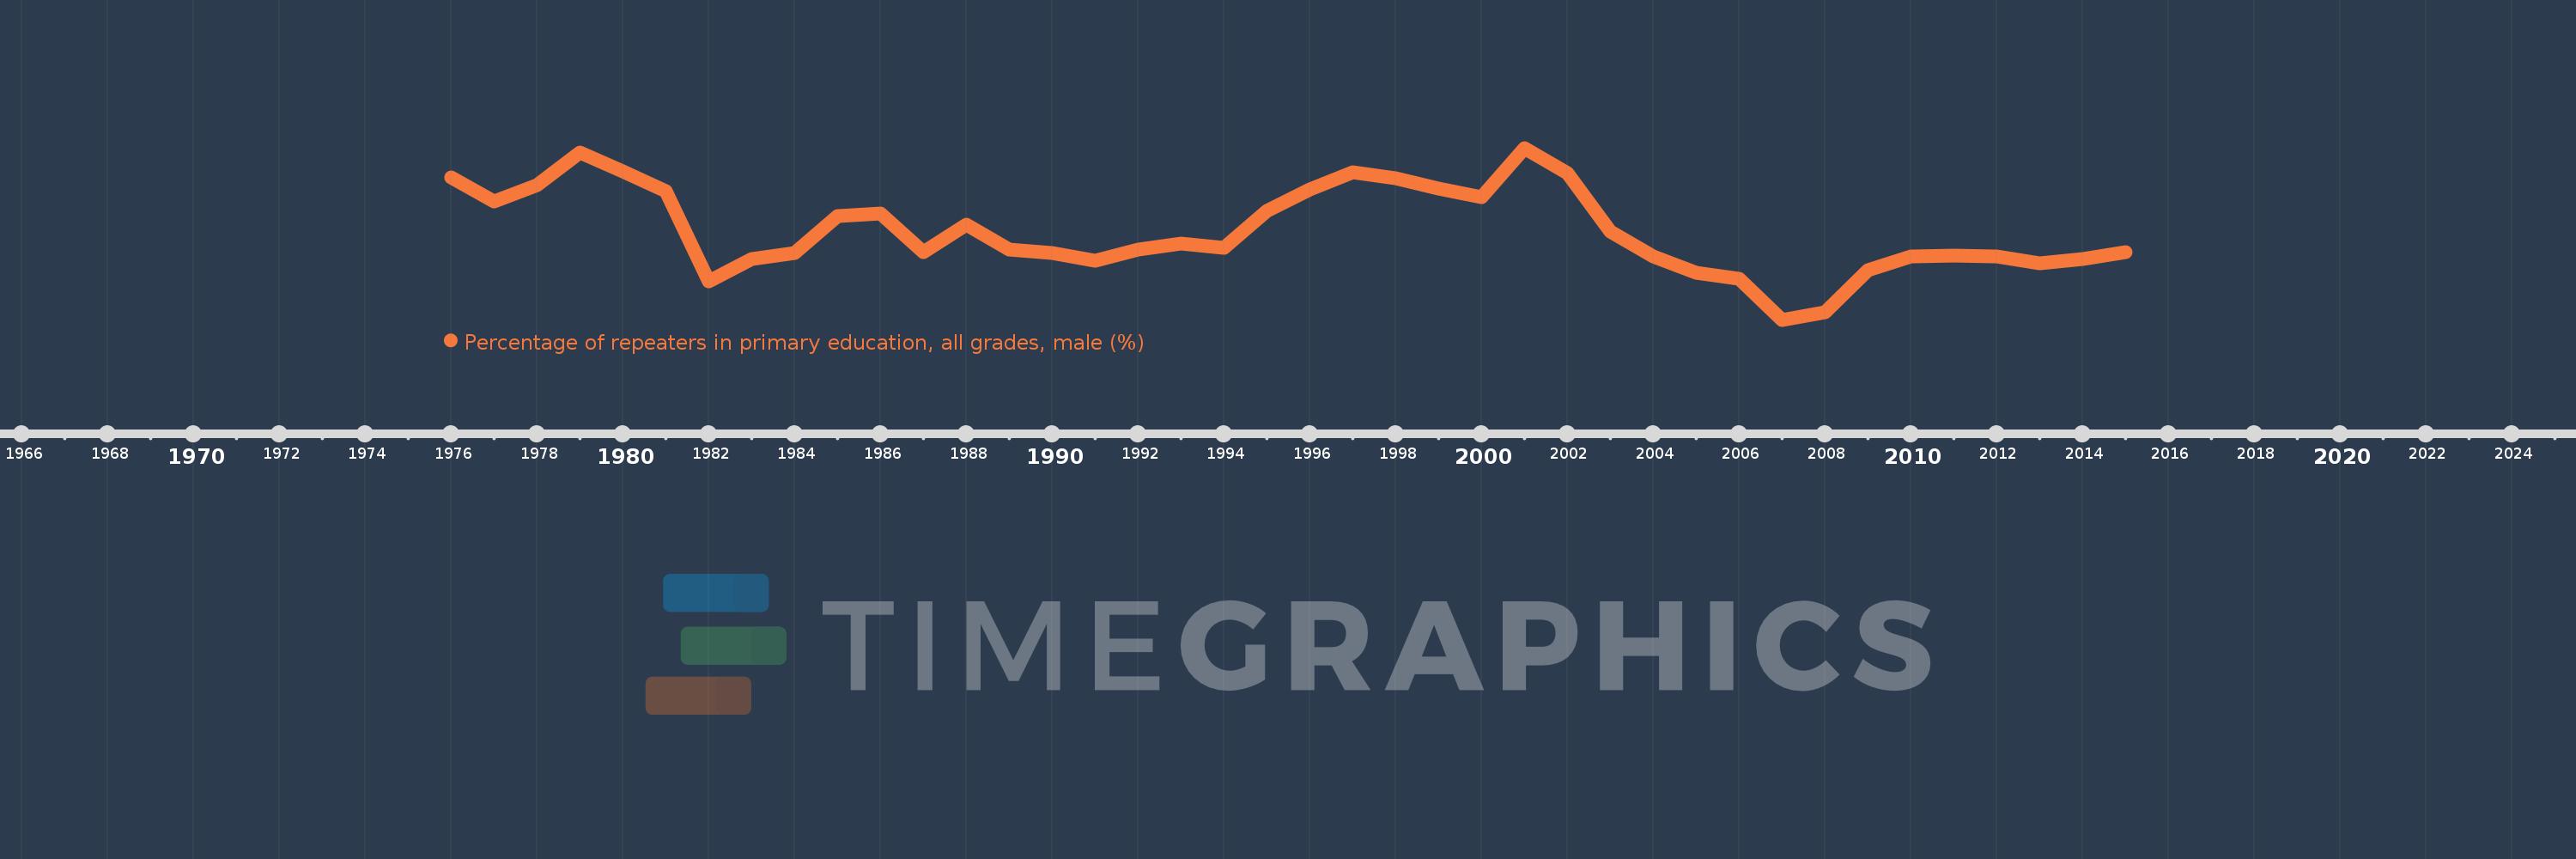
Percentage of repeaters in primary education, all grades, male (%)
2015,2014,2013,2012,2011,2010,2009,2008,2007,2006,2005,2004,2003,2002,2001,2000,1999,1998,1997,1996,1995,1994,1993,1992,1991,1990,1989,1988,1987,1986,1985,1984,1983,1982,1981,1980,1979,1978,1977,1976
This statistics in other country:
AfghanistanAlbaniaAlgeriaAndorraAngolaAntigua and BarbudaArab WorldArgentinaArmeniaArubaAustriaAzerbaijanBahamas, TheBahrainBangladeshBelarusBelgiumBelizeBeninBermudaBhutanBoliviaBosnia and HerzegovinaBotswanaBrazilBritish Virgin IslandsBrunei DarussalamBulgariaBurkina FasoBurundiCabo VerdeCambodiaCameroonCanadaCaribbean small statesCayman IslandsCentral African RepublicCentral Europe and the BalticsChadChileChinaColombiaComorosCongo, Dem. Rep.Congo, Rep.Costa RicaCote d'IvoireCroatiaCubaCyprusCzech RepublicDenmarkDjiboutiDominicaDominican RepublicEarly-demographic dividendEast Asia & PacificEast Asia & Pacific (excluding high income)East Asia & Pacific (IDA & IBRD countries)EcuadorEgypt, Arab Rep.El SalvadorEquatorial GuineaEritreaEstoniaEthiopiaEuro areaEurope & Central AsiaEurope & Central Asia (excluding high income)Europe & Central Asia (IDA & IBRD countries)European UnionFijiFinlandFragile and conflict affected situationsFranceGabonGambia, TheGeorgiaGermanyGhanaGreeceGrenadaGuatemalaGuineaGuinea-BissauGuyanaHaitiHeavily indebted poor countries (HIPC)High incomeHondurasHong Kong SAR, ChinaHungaryIBRD onlyIcelandIDA & IBRD totalIDA blendIDA onlyIDA totalIndiaIndonesiaIran, Islamic Rep.IraqIrelandIsraelItalyJamaicaJapanJordanKazakhstanKenyaKiribatiKorea, Rep.KuwaitKyrgyz RepublicLao PDRLate-demographic dividendLatin America & Caribbean Latin America & Caribbean (excluding high income)Latin America & the Caribbean (IDA & IBRD countries)LatviaLeast developed countries: UN classificationLebanonLesothoLiberiaLibyaLiechtensteinLithuaniaLow & middle incomeLow incomeLower middle incomeLuxembourgMacao SAR, ChinaMacedonia, FYRMadagascarMalawiMalaysiaMaldivesMaliMaltaMauritaniaMauritiusMexicoMiddle East & North AfricaMiddle East & North Africa (excluding high income)Middle East & North Africa (IDA & IBRD countries)Middle incomeMoldovaMonacoMongoliaMontenegroMoroccoMozambiqueMyanmarNamibiaNauruNepalNetherlandsNew ZealandNicaraguaNigerNorwayOECD membersOmanOther small statesPacific island small statesPakistanPalauPanamaPapua New GuineaParaguayPeruPhilippinesPolandPortugalPost-demographic dividendPre-demographic dividendQatarRomaniaRussian FederationRwandaSamoaSan MarinoSao Tome and PrincipeSaudi ArabiaSenegalSerbiaSeychellesSierra LeoneSingaporeSint Maarten (Dutch part)Slovak RepublicSloveniaSmall statesSolomon IslandsSomaliaSouth AfricaSouth AsiaSouth Asia (IDA & IBRD)South SudanSpainSri LankaSt. Kitts and NevisSt. LuciaSt. Vincent and the GrenadinesSub-Saharan Africa Sub-Saharan Africa (excluding high income)Sub-Saharan Africa (IDA & IBRD countries)SudanSurinameSwazilandSwedenSwitzerlandSyrian Arab RepublicTajikistanTanzaniaThailandTimor-LesteTogoTongaTrinidad and TobagoTunisiaTurkeyTurks and Caicos IslandsTuvaluUgandaUkraineUnited Arab EmiratesUnited KingdomUpper middle incomeUruguayUzbekistanVanuatuVenezuela, RBVietnamWest Bank and GazaWorldYemen, Rep.ZambiaZimbabwe Timeline:
This timeline shows a graph from 1976 to 2015 of Caribbean small states. No data until 1975. Number of actual observations by date: 40.
Source name:
World Development Indicators
Source organization:
UNESCO Institute for Statistics
Categories, topics:
Education, Gender
Last updated:
apr 23, 2017
Indicators value changes by year
At the date of observation
Value
Absolute change
Change from previous value
jan 1, 1976
6.765
+6.765
0.0%
jan 1, 1977
6.418
-0.347
-5.12%
jan 1, 1978
6.661
+0.243
3.79%
jan 1, 1979
7.133
+0.471
7.07%
jan 1, 1980
6.851
-0.282
-3.95%
jan 1, 1981
6.563
-0.288
-4.2%
jan 1, 1982
5.258
-1.305
-19.89%
jan 1, 1983
5.583
+0.325
6.18%
jan 1, 1984
5.672
+0.09
1.61%
jan 1, 1985
6.211
+0.538
9.49%
jan 1, 1986
6.243
+0.032
0.52%
jan 1, 1987
5.684
-0.559
-8.96%
jan 1, 1988
6.078
+0.394
6.93%
jan 1, 1989
5.72
-0.357
-5.88%
jan 1, 1990
5.67
-0.05
-0.88%
jan 1, 1991
5.558
-0.112
-1.98%
jan 1, 1992
5.723
+0.165
2.96%
jan 1, 1993
5.813
+0.09
1.57%
jan 1, 1994
5.752
-0.061
-1.05%
jan 1, 1995
6.284
+0.532
9.24%
jan 1, 1996
6.598
+0.314
5.0%
jan 1, 1997
6.848
+0.25
3.79%
jan 1, 1998
6.752
-0.096
-1.4%
jan 1, 1999
6.605
-0.148
-2.19%
jan 1, 2000
6.483
-0.122
-1.85%
jan 1, 2001
7.196
+0.714
11.01%
jan 1, 2002
6.835
-0.361
-5.02%
jan 1, 2003
5.986
-0.849
-12.42%
jan 1, 2004
5.62
-0.365
-6.1%
jan 1, 2005
5.38
-0.24
-4.27%
jan 1, 2006
5.297
-0.083
-1.55%
jan 1, 2007
4.703
-0.594
-11.22%
jan 1, 2008
4.813
+0.111
2.35%
jan 1, 2009
5.425
+0.612
12.7%
jan 1, 2010
5.627
+0.202
3.72%
jan 1, 2011
5.628
+0.002
0.03%
jan 1, 2012
5.621
-0.007
-0.13%
jan 1, 2013
5.524
-0.097
-1.72%
jan 1, 2014
5.584
+0.06
1.08%
jan 1, 2015
5.686
+0.102
1.82%
Ranking of countries by current statistics by years


Comments: