29
/
en
AIzaSyAYiBZKx7MnpbEhh9jyipgxe19OcubqV5w
April 1, 2024
30193
Euro area
EMU
false
2
1
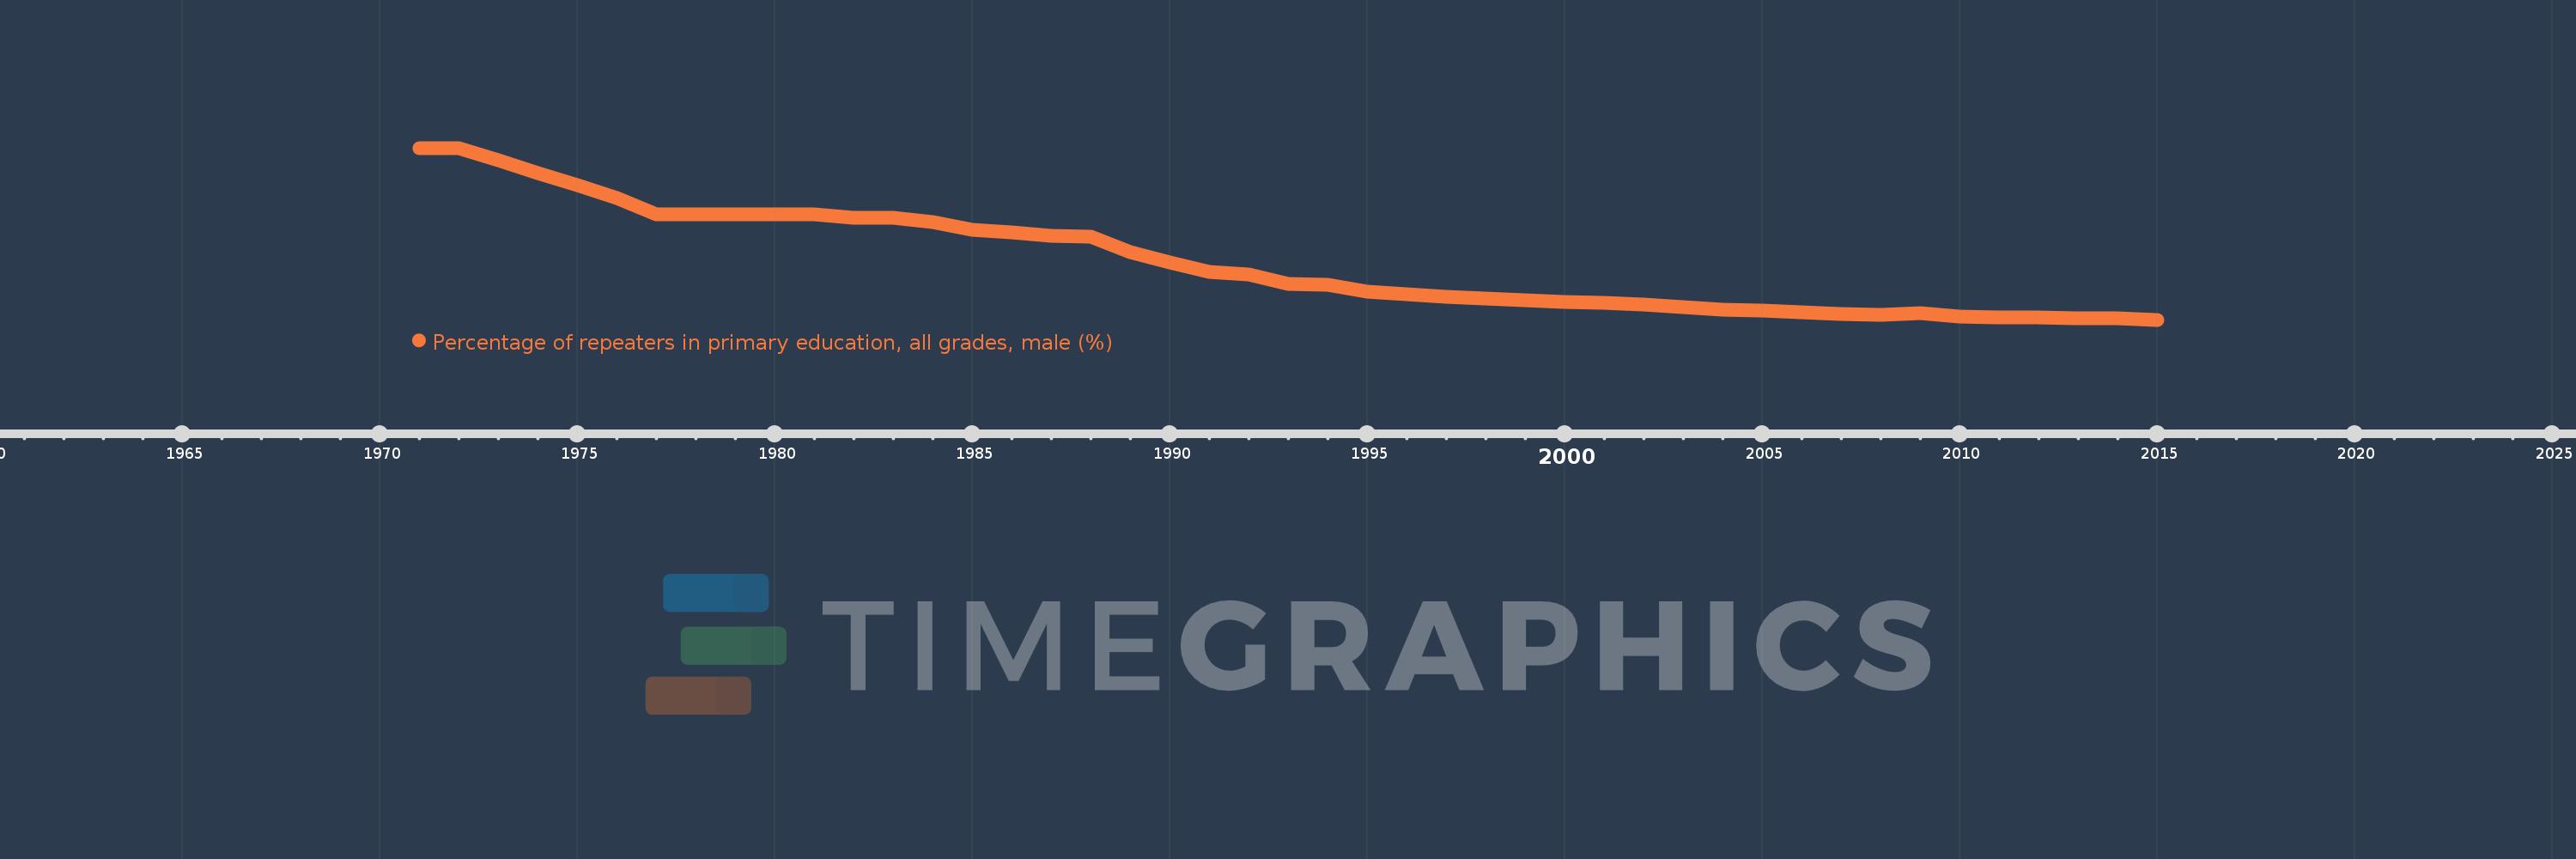
Percentage of repeaters in primary education, all grades, male (%)
2015,2014,2013,2012,2011,2010,2009,2008,2007,2006,2005,2004,2003,2002,2001,2000,1999,1998,1997,1996,1995,1994,1993,1992,1991,1990,1989,1988,1987,1986,1985,1984,1983,1982,1981,1980,1979,1978,1977,1976,1975,1974,1973,1972,1971
This statistics in other country:
AfghanistanAlbaniaAlgeriaAndorraAngolaAntigua and BarbudaArab WorldArgentinaArmeniaArubaAustriaAzerbaijanBahamas, TheBahrainBangladeshBelarusBelgiumBelizeBeninBermudaBhutanBoliviaBosnia and HerzegovinaBotswanaBrazilBritish Virgin IslandsBrunei DarussalamBulgariaBurkina FasoBurundiCabo VerdeCambodiaCameroonCanadaCaribbean small statesCayman IslandsCentral African RepublicCentral Europe and the BalticsChadChileChinaColombiaComorosCongo, Dem. Rep.Congo, Rep.Costa RicaCote d'IvoireCroatiaCubaCyprusCzech RepublicDenmarkDjiboutiDominicaDominican RepublicEarly-demographic dividendEast Asia & PacificEast Asia & Pacific (excluding high income)East Asia & Pacific (IDA & IBRD countries)EcuadorEgypt, Arab Rep.El SalvadorEquatorial GuineaEritreaEstoniaEthiopiaEuro areaEurope & Central AsiaEurope & Central Asia (excluding high income)Europe & Central Asia (IDA & IBRD countries)European UnionFijiFinlandFragile and conflict affected situationsFranceGabonGambia, TheGeorgiaGermanyGhanaGreeceGrenadaGuatemalaGuineaGuinea-BissauGuyanaHaitiHeavily indebted poor countries (HIPC)High incomeHondurasHong Kong SAR, ChinaHungaryIBRD onlyIcelandIDA & IBRD totalIDA blendIDA onlyIDA totalIndiaIndonesiaIran, Islamic Rep.IraqIrelandIsraelItalyJamaicaJapanJordanKazakhstanKenyaKiribatiKorea, Rep.KuwaitKyrgyz RepublicLao PDRLate-demographic dividendLatin America & Caribbean Latin America & Caribbean (excluding high income)Latin America & the Caribbean (IDA & IBRD countries)LatviaLeast developed countries: UN classificationLebanonLesothoLiberiaLibyaLiechtensteinLithuaniaLow & middle incomeLow incomeLower middle incomeLuxembourgMacao SAR, ChinaMacedonia, FYRMadagascarMalawiMalaysiaMaldivesMaliMaltaMauritaniaMauritiusMexicoMiddle East & North AfricaMiddle East & North Africa (excluding high income)Middle East & North Africa (IDA & IBRD countries)Middle incomeMoldovaMonacoMongoliaMontenegroMoroccoMozambiqueMyanmarNamibiaNauruNepalNetherlandsNew ZealandNicaraguaNigerNorwayOECD membersOmanOther small statesPacific island small statesPakistanPalauPanamaPapua New GuineaParaguayPeruPhilippinesPolandPortugalPost-demographic dividendPre-demographic dividendQatarRomaniaRussian FederationRwandaSamoaSan MarinoSao Tome and PrincipeSaudi ArabiaSenegalSerbiaSeychellesSierra LeoneSingaporeSint Maarten (Dutch part)Slovak RepublicSloveniaSmall statesSolomon IslandsSomaliaSouth AfricaSouth AsiaSouth Asia (IDA & IBRD)South SudanSpainSri LankaSt. Kitts and NevisSt. LuciaSt. Vincent and the GrenadinesSub-Saharan Africa Sub-Saharan Africa (excluding high income)Sub-Saharan Africa (IDA & IBRD countries)SudanSurinameSwazilandSwedenSwitzerlandSyrian Arab RepublicTajikistanTanzaniaThailandTimor-LesteTogoTongaTrinidad and TobagoTunisiaTurkeyTurks and Caicos IslandsTuvaluUgandaUkraineUnited Arab EmiratesUnited KingdomUpper middle incomeUruguayUzbekistanVanuatuVenezuela, RBVietnamWest Bank and GazaWorldYemen, Rep.ZambiaZimbabwe Timeline:
This timeline shows a graph from 1971 to 2015 of Euro area. No data until 1970. Number of actual observations by date: 45.
Source name:
World Development Indicators
Source organization:
UNESCO Institute for Statistics
Categories, topics:
Education, Gender
Last updated:
apr 23, 2017
Indicators value changes by year
At the date of observation
Value
Absolute change
Change from previous value
jan 1, 1971
8.607
+8.607
0.0%
jan 1, 1972
8.605
-0.002
-0.02%
jan 1, 1973
8.071
-0.534
-6.21%
jan 1, 1974
7.465
-0.606
-7.51%
jan 1, 1975
6.941
-0.523
-7.01%
jan 1, 1976
6.366
-0.575
-8.29%
jan 1, 1977
5.617
-0.749
-11.76%
jan 1, 1978
5.635
+0.018
0.32%
jan 1, 1979
5.644
+0.009
0.17%
jan 1, 1980
5.62
-0.024
-0.43%
jan 1, 1981
5.639
+0.019
0.34%
jan 1, 1982
5.481
-0.158
-2.8%
jan 1, 1983
5.484
+0.004
0.07%
jan 1, 1984
5.269
-0.216
-3.94%
jan 1, 1985
4.926
-0.343
-6.51%
jan 1, 1986
4.813
-0.113
-2.29%
jan 1, 1987
4.647
-0.166
-3.44%
jan 1, 1988
4.615
-0.032
-0.68%
jan 1, 1989
3.936
-0.68
-14.72%
jan 1, 1990
3.48
-0.456
-11.59%
jan 1, 1991
3.052
-0.428
-12.3%
jan 1, 1992
2.911
-0.141
-4.6%
jan 1, 1993
2.493
-0.419
-14.38%
jan 1, 1994
2.457
-0.035
-1.42%
jan 1, 1995
2.147
-0.31
-12.61%
jan 1, 1996
2.022
-0.126
-5.85%
jan 1, 1997
1.927
-0.095
-4.69%
jan 1, 1998
1.854
-0.073
-3.8%
jan 1, 1999
1.779
-0.075
-4.04%
jan 1, 2000
1.705
-0.074
-4.18%
jan 1, 2001
1.658
-0.047
-2.73%
jan 1, 2002
1.581
-0.077
-4.62%
jan 1, 2003
1.471
-0.11
-6.95%
jan 1, 2004
1.355
-0.116
-7.89%
jan 1, 2005
1.299
-0.056
-4.13%
jan 1, 2006
1.217
-0.083
-6.37%
jan 1, 2007
1.16
-0.056
-4.64%
jan 1, 2008
1.114
-0.046
-4.0%
jan 1, 2009
1.178
+0.065
5.79%
jan 1, 2010
1.032
-0.146
-12.38%
jan 1, 2011
0.997
-0.035
-3.44%
jan 1, 2012
1.004
+0.007
0.71%
jan 1, 2013
0.948
-0.056
-5.61%
jan 1, 2014
0.94
-0.008
-0.82%
jan 1, 2015
0.891
-0.049
-5.25%
Ranking of countries by current statistics by years


Comments: