29
/
en
AIzaSyAYiBZKx7MnpbEhh9jyipgxe19OcubqV5w
April 1, 2024
60163
Sub-Saharan Africa (excluding high income)
SSA
false
2
1
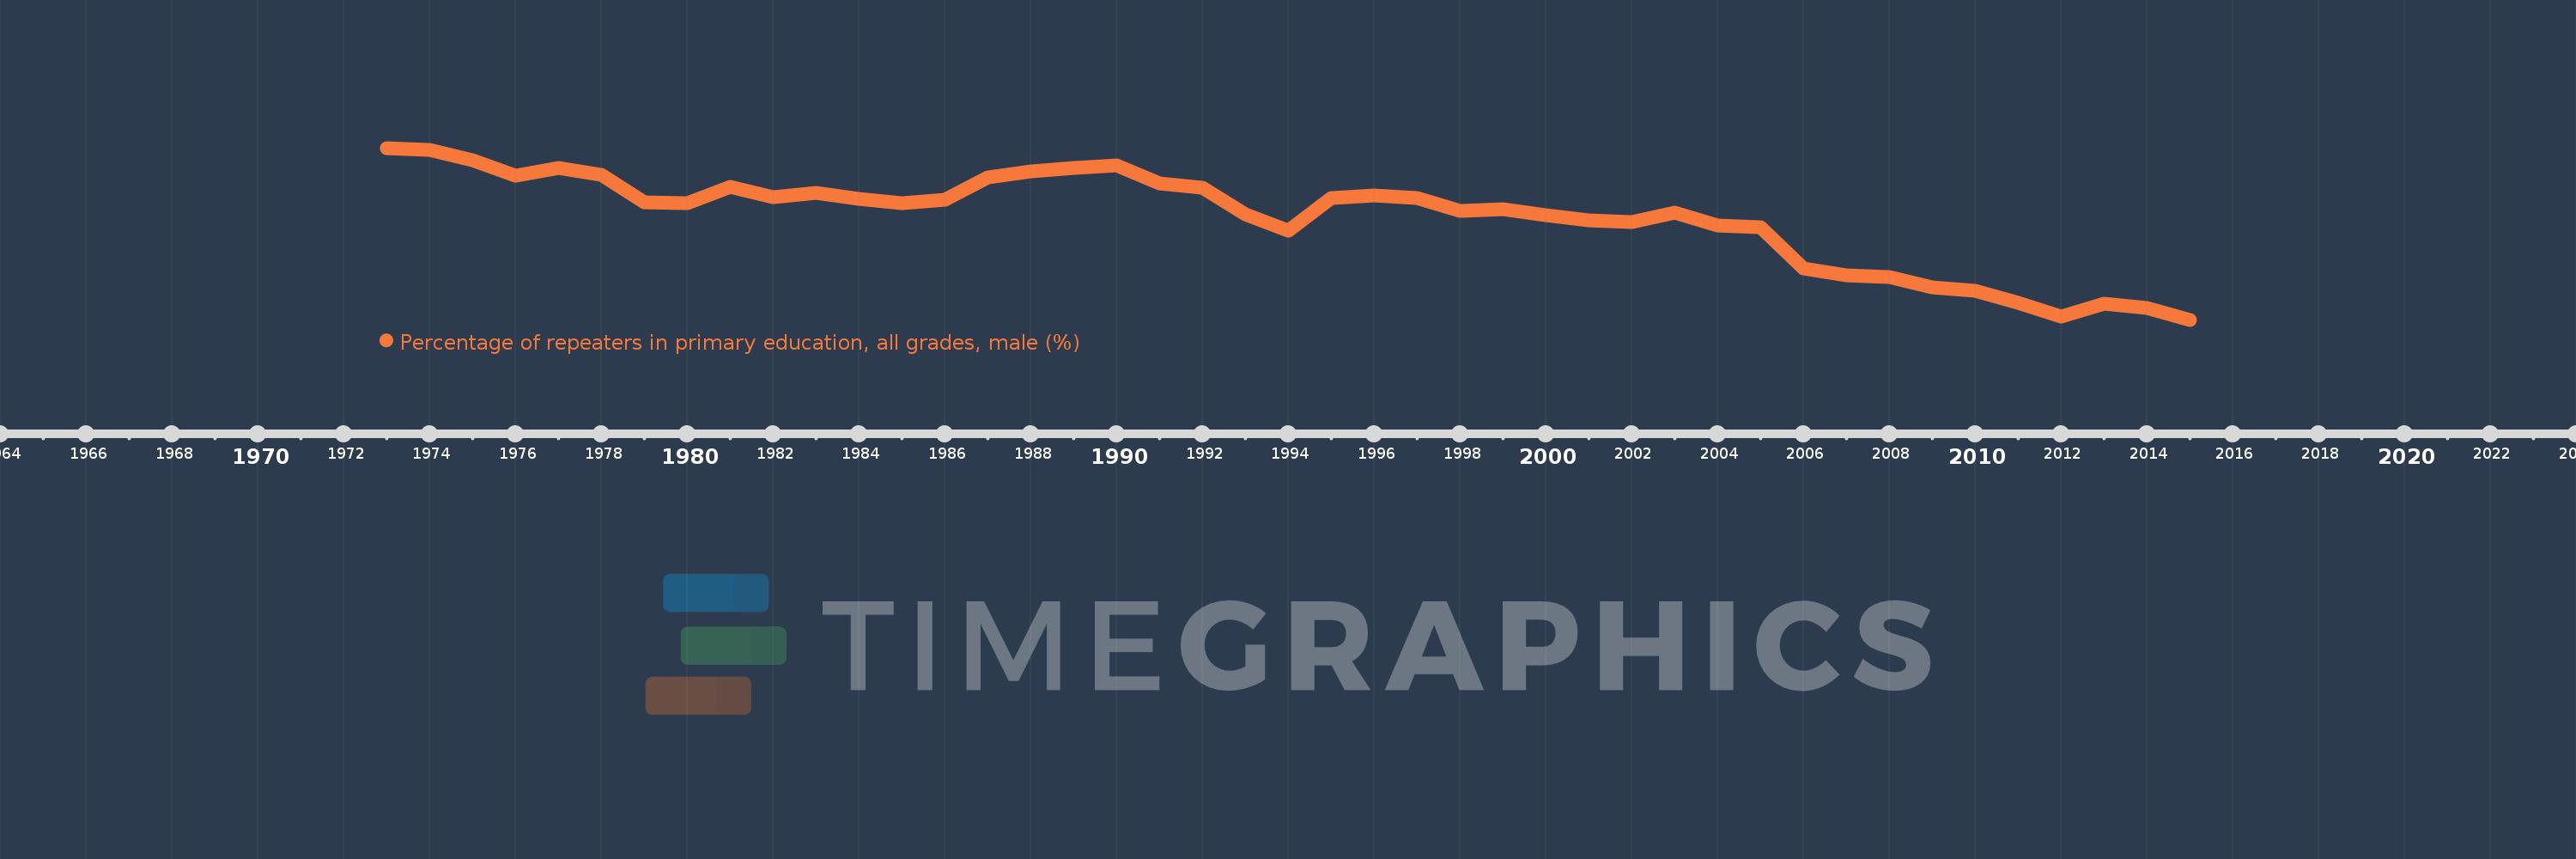
Percentage of repeaters in primary education, all grades, male (%)
2015,2014,2013,2012,2011,2010,2009,2008,2007,2006,2005,2004,2003,2002,2001,2000,1999,1998,1997,1996,1995,1994,1993,1992,1991,1990,1989,1988,1987,1986,1985,1984,1983,1982,1981,1980,1979,1978,1977,1976,1975,1974,1973
This statistics in other country:
AfghanistanAlbaniaAlgeriaAndorraAngolaAntigua and BarbudaArab WorldArgentinaArmeniaArubaAustriaAzerbaijanBahamas, TheBahrainBangladeshBelarusBelgiumBelizeBeninBermudaBhutanBoliviaBosnia and HerzegovinaBotswanaBrazilBritish Virgin IslandsBrunei DarussalamBulgariaBurkina FasoBurundiCabo VerdeCambodiaCameroonCanadaCaribbean small statesCayman IslandsCentral African RepublicCentral Europe and the BalticsChadChileChinaColombiaComorosCongo, Dem. Rep.Congo, Rep.Costa RicaCote d'IvoireCroatiaCubaCyprusCzech RepublicDenmarkDjiboutiDominicaDominican RepublicEarly-demographic dividendEast Asia & PacificEast Asia & Pacific (excluding high income)East Asia & Pacific (IDA & IBRD countries)EcuadorEgypt, Arab Rep.El SalvadorEquatorial GuineaEritreaEstoniaEthiopiaEuro areaEurope & Central AsiaEurope & Central Asia (excluding high income)Europe & Central Asia (IDA & IBRD countries)European UnionFijiFinlandFragile and conflict affected situationsFranceGabonGambia, TheGeorgiaGermanyGhanaGreeceGrenadaGuatemalaGuineaGuinea-BissauGuyanaHaitiHeavily indebted poor countries (HIPC)High incomeHondurasHong Kong SAR, ChinaHungaryIBRD onlyIcelandIDA & IBRD totalIDA blendIDA onlyIDA totalIndiaIndonesiaIran, Islamic Rep.IraqIrelandIsraelItalyJamaicaJapanJordanKazakhstanKenyaKiribatiKorea, Rep.KuwaitKyrgyz RepublicLao PDRLate-demographic dividendLatin America & Caribbean Latin America & Caribbean (excluding high income)Latin America & the Caribbean (IDA & IBRD countries)LatviaLeast developed countries: UN classificationLebanonLesothoLiberiaLibyaLiechtensteinLithuaniaLow & middle incomeLow incomeLower middle incomeLuxembourgMacao SAR, ChinaMacedonia, FYRMadagascarMalawiMalaysiaMaldivesMaliMaltaMauritaniaMauritiusMexicoMiddle East & North AfricaMiddle East & North Africa (excluding high income)Middle East & North Africa (IDA & IBRD countries)Middle incomeMoldovaMonacoMongoliaMontenegroMoroccoMozambiqueMyanmarNamibiaNauruNepalNetherlandsNew ZealandNicaraguaNigerNorwayOECD membersOmanOther small statesPacific island small statesPakistanPalauPanamaPapua New GuineaParaguayPeruPhilippinesPolandPortugalPost-demographic dividendPre-demographic dividendQatarRomaniaRussian FederationRwandaSamoaSan MarinoSao Tome and PrincipeSaudi ArabiaSenegalSerbiaSeychellesSierra LeoneSingaporeSint Maarten (Dutch part)Slovak RepublicSloveniaSmall statesSolomon IslandsSomaliaSouth AfricaSouth AsiaSouth Asia (IDA & IBRD)South SudanSpainSri LankaSt. Kitts and NevisSt. LuciaSt. Vincent and the GrenadinesSub-Saharan Africa Sub-Saharan Africa (excluding high income)Sub-Saharan Africa (IDA & IBRD countries)SudanSurinameSwazilandSwedenSwitzerlandSyrian Arab RepublicTajikistanTanzaniaThailandTimor-LesteTogoTongaTrinidad and TobagoTunisiaTurkeyTurks and Caicos IslandsTuvaluUgandaUkraineUnited Arab EmiratesUnited KingdomUpper middle incomeUruguayUzbekistanVanuatuVenezuela, RBVietnamWest Bank and GazaWorldYemen, Rep.ZambiaZimbabwe Timeline:
This timeline shows a graph from 1973 to 2015 of Sub-Saharan Africa (excluding high income). No data until 1972. Number of actual observations by date: 43.
Source name:
World Development Indicators
Source organization:
UNESCO Institute for Statistics
Categories, topics:
Education, Gender
Last updated:
apr 23, 2017
Indicators value changes by year
Maximum:
12.721
jan 1, 1973
At the date of observation
Value
Absolute change
Change from previous value
jan 1, 1973
12.721
+12.721
0.0%
jan 1, 1974
12.669
-0.052
-0.41%
jan 1, 1975
12.41
-0.259
-2.04%
jan 1, 1976
12.01
-0.4
-3.22%
jan 1, 1977
12.206
+0.196
1.63%
jan 1, 1978
12.031
-0.175
-1.44%
jan 1, 1979
11.324
-0.707
-5.87%
jan 1, 1980
11.296
-0.028
-0.25%
jan 1, 1981
11.711
+0.415
3.68%
jan 1, 1982
11.457
-0.254
-2.17%
jan 1, 1983
11.561
+0.104
0.91%
jan 1, 1984
11.399
-0.163
-1.41%
jan 1, 1985
11.29
-0.109
-0.95%
jan 1, 1986
11.373
+0.083
0.74%
jan 1, 1987
11.958
+0.585
5.14%
jan 1, 1988
12.116
+0.158
1.32%
jan 1, 1989
12.211
+0.095
0.78%
jan 1, 1990
12.269
+0.058
0.47%
jan 1, 1991
11.81
-0.458
-3.73%
jan 1, 1992
11.689
-0.121
-1.02%
jan 1, 1993
10.993
-0.697
-5.96%
jan 1, 1994
10.583
-0.41
-3.73%
jan 1, 1995
11.424
+0.842
7.95%
jan 1, 1996
11.502
+0.078
0.68%
jan 1, 1997
11.419
-0.083
-0.72%
jan 1, 1998
11.095
-0.324
-2.84%
jan 1, 1999
11.144
+0.049
0.45%
jan 1, 2000
10.972
-0.173
-1.55%
jan 1, 2001
10.843
-0.129
-1.18%
jan 1, 2002
10.802
-0.041
-0.38%
jan 1, 2003
11.044
+0.242
2.24%
jan 1, 2004
10.708
-0.336
-3.04%
jan 1, 2005
10.667
-0.041
-0.39%
jan 1, 2006
9.595
-1.072
-10.05%
jan 1, 2007
9.424
-0.17
-1.77%
jan 1, 2008
9.386
-0.039
-0.41%
jan 1, 2009
9.123
-0.262
-2.79%
jan 1, 2010
9.024
-0.1
-1.09%
jan 1, 2011
8.719
-0.305
-3.37%
jan 1, 2012
8.355
-0.364
-4.17%
jan 1, 2013
8.687
+0.332
3.98%
jan 1, 2014
8.588
-0.1
-1.15%
jan 1, 2015
8.277
-0.311
-3.62%
Ranking of countries by current statistics by years


Comments: