29
/
en
AIzaSyAYiBZKx7MnpbEhh9jyipgxe19OcubqV5w
April 1, 2024
123959
Ecuador
ECU
true
2
1
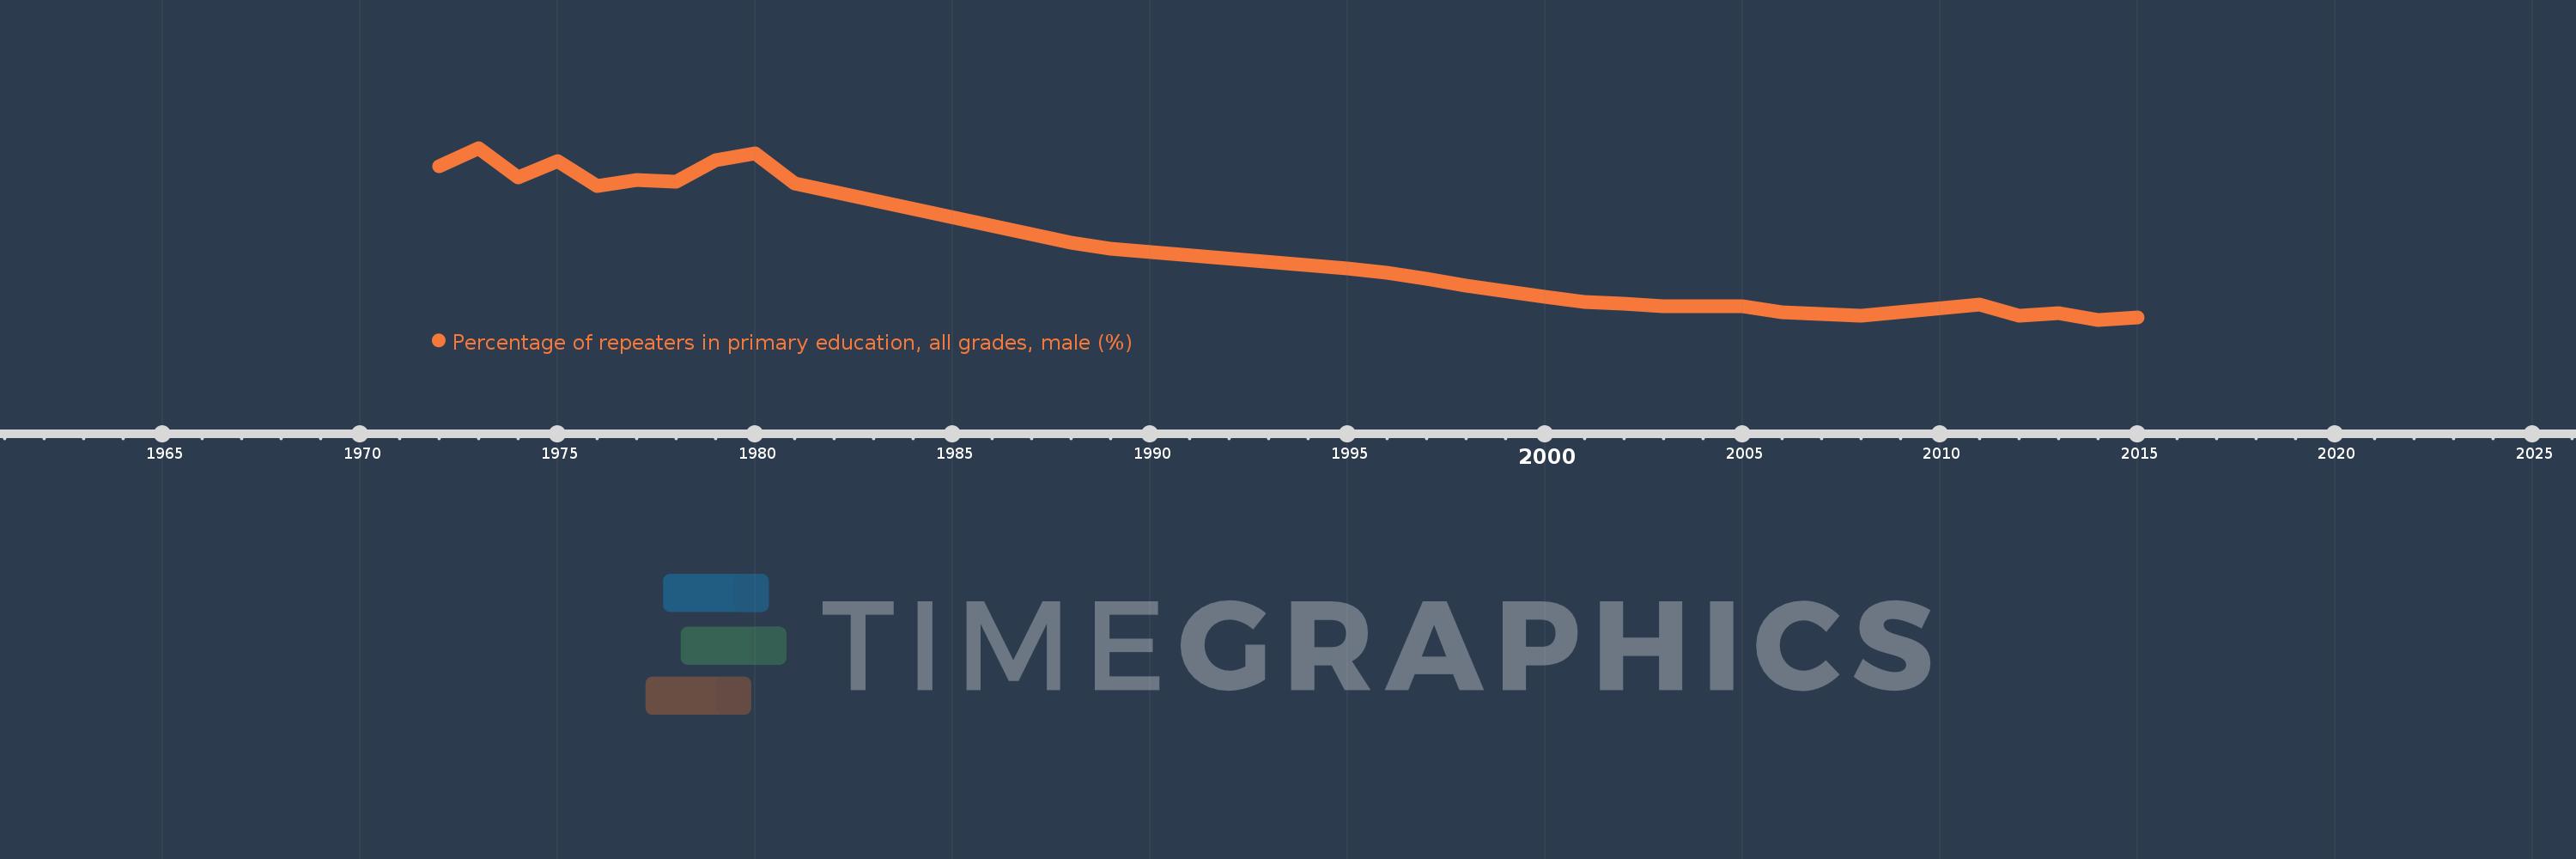
Percentage of repeaters in primary education, all grades, male (%)
2015,2014,2013,2012,2011,2008,2007,2006,2005,2004,2003,2002,2001,2000,1998,1997,1996,1995,1989,1988,1981,1980,1979,1978,1977,1976,1975,1974,1973,1972
This statistics in other country:
AfghanistanAlbaniaAlgeriaAndorraAngolaAntigua and BarbudaArab WorldArgentinaArmeniaArubaAustriaAzerbaijanBahamas, TheBahrainBangladeshBelarusBelgiumBelizeBeninBermudaBhutanBoliviaBosnia and HerzegovinaBotswanaBrazilBritish Virgin IslandsBrunei DarussalamBulgariaBurkina FasoBurundiCabo VerdeCambodiaCameroonCanadaCaribbean small statesCayman IslandsCentral African RepublicCentral Europe and the BalticsChadChileChinaColombiaComorosCongo, Dem. Rep.Congo, Rep.Costa RicaCote d'IvoireCroatiaCubaCyprusCzech RepublicDenmarkDjiboutiDominicaDominican RepublicEarly-demographic dividendEast Asia & PacificEast Asia & Pacific (excluding high income)East Asia & Pacific (IDA & IBRD countries)EcuadorEgypt, Arab Rep.El SalvadorEquatorial GuineaEritreaEstoniaEthiopiaEuro areaEurope & Central AsiaEurope & Central Asia (excluding high income)Europe & Central Asia (IDA & IBRD countries)European UnionFijiFinlandFragile and conflict affected situationsFranceGabonGambia, TheGeorgiaGermanyGhanaGreeceGrenadaGuatemalaGuineaGuinea-BissauGuyanaHaitiHeavily indebted poor countries (HIPC)High incomeHondurasHong Kong SAR, ChinaHungaryIBRD onlyIcelandIDA & IBRD totalIDA blendIDA onlyIDA totalIndiaIndonesiaIran, Islamic Rep.IraqIrelandIsraelItalyJamaicaJapanJordanKazakhstanKenyaKiribatiKorea, Rep.KuwaitKyrgyz RepublicLao PDRLate-demographic dividendLatin America & Caribbean Latin America & Caribbean (excluding high income)Latin America & the Caribbean (IDA & IBRD countries)LatviaLeast developed countries: UN classificationLebanonLesothoLiberiaLibyaLiechtensteinLithuaniaLow & middle incomeLow incomeLower middle incomeLuxembourgMacao SAR, ChinaMacedonia, FYRMadagascarMalawiMalaysiaMaldivesMaliMaltaMauritaniaMauritiusMexicoMiddle East & North AfricaMiddle East & North Africa (excluding high income)Middle East & North Africa (IDA & IBRD countries)Middle incomeMoldovaMonacoMongoliaMontenegroMoroccoMozambiqueMyanmarNamibiaNauruNepalNetherlandsNew ZealandNicaraguaNigerNorwayOECD membersOmanOther small statesPacific island small statesPakistanPalauPanamaPapua New GuineaParaguayPeruPhilippinesPolandPortugalPost-demographic dividendPre-demographic dividendQatarRomaniaRussian FederationRwandaSamoaSan MarinoSao Tome and PrincipeSaudi ArabiaSenegalSerbiaSeychellesSierra LeoneSingaporeSint Maarten (Dutch part)Slovak RepublicSloveniaSmall statesSolomon IslandsSomaliaSouth AfricaSouth AsiaSouth Asia (IDA & IBRD)South SudanSpainSri LankaSt. Kitts and NevisSt. LuciaSt. Vincent and the GrenadinesSub-Saharan Africa Sub-Saharan Africa (excluding high income)Sub-Saharan Africa (IDA & IBRD countries)SudanSurinameSwazilandSwedenSwitzerlandSyrian Arab RepublicTajikistanTanzaniaThailandTimor-LesteTogoTongaTrinidad and TobagoTunisiaTurkeyTurks and Caicos IslandsTuvaluUgandaUkraineUnited Arab EmiratesUnited KingdomUpper middle incomeUruguayUzbekistanVanuatuVenezuela, RBVietnamWest Bank and GazaWorldYemen, Rep.ZambiaZimbabwe Timeline:
This timeline shows a graph from 1972 to 2015 of Ecuador. No data until 1971. Number of actual observations by date: 30.
Source name:
World Development Indicators
Source organization:
UNESCO Institute for Statistics
Categories, topics:
Education, Gender
Last updated:
apr 23, 2017
Indicators value changes by year
Maximum:
14.165
jan 1, 1973
At the date of observation
Value
Absolute change
Change from previous value
jan 1, 1972
12.792
+12.792
0.0%
jan 1, 1973
14.165
+1.373
10.74%
jan 1, 1974
11.966
-2.2
-15.53%
jan 1, 1975
13.172
+1.206
10.08%
jan 1, 1976
11.339
-1.833
-13.92%
jan 1, 1977
11.771
+0.432
3.81%
jan 1, 1978
11.601
-0.17
-1.44%
jan 1, 1979
13.244
+1.643
14.16%
jan 1, 1980
13.75
+0.506
3.82%
jan 1, 1981
11.533
-2.218
-16.13%
jan 1, 1988
7.053
-4.48
-38.85%
jan 1, 1989
6.619
-0.434
-6.15%
jan 1, 1995
5.15
-1.469
-22.19%
jan 1, 1996
4.769
-0.381
-7.4%
jan 1, 1997
4.336
-0.433
-9.08%
jan 1, 1998
3.814
-0.522
-12.04%
jan 1, 2000
2.985
-0.829
-21.73%
jan 1, 2001
2.62
-0.365
-12.24%
jan 1, 2002
2.483
-0.137
-5.22%
jan 1, 2003
2.29
-0.193
-7.76%
jan 1, 2004
2.257
-0.033
-1.44%
jan 1, 2005
2.257
0.0
-0.01%
jan 1, 2006
1.86
-0.398
-17.62%
jan 1, 2007
1.715
-0.145
-7.77%
jan 1, 2008
1.585
-0.13
-7.6%
jan 1, 2011
2.422
+0.837
52.85%
jan 1, 2012
1.554
-0.868
-35.86%
jan 1, 2013
1.767
+0.213
13.71%
jan 1, 2014
1.276
-0.491
-27.77%
jan 1, 2015
1.451
+0.175
13.75%
Ranking of countries by current statistics by years


Comments: