29
/
en
AIzaSyAYiBZKx7MnpbEhh9jyipgxe19OcubqV5w
April 1, 2024
66469
Algeria
DZA
true
2
1
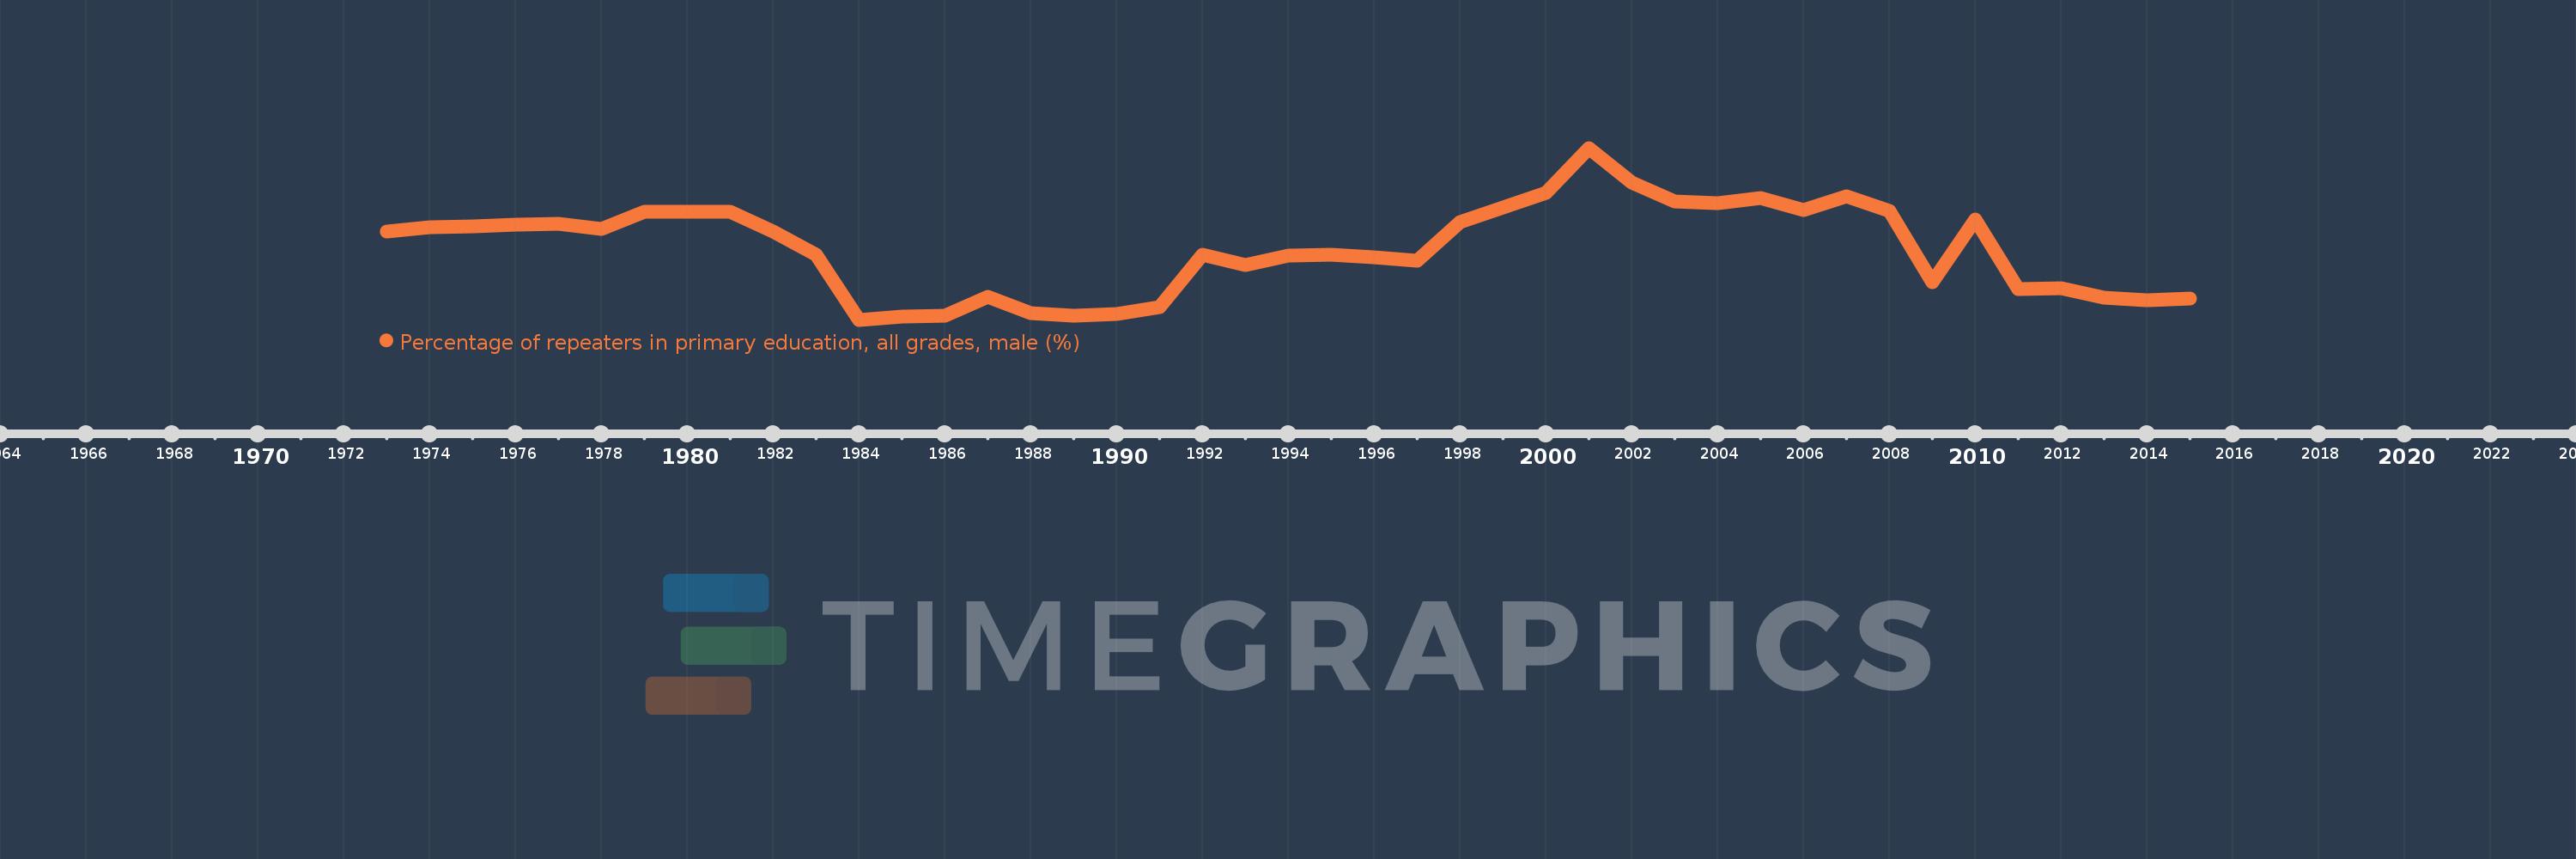
Percentage of repeaters in primary education, all grades, male (%)
2015,2014,2013,2012,2011,2010,2009,2008,2007,2006,2005,2004,2003,2002,2001,2000,1998,1997,1996,1995,1994,1993,1992,1991,1990,1989,1988,1987,1986,1985,1984,1983,1982,1981,1980,1979,1978,1977,1976,1975,1974,1973
This statistics in other country:
AfghanistanAlbaniaAlgeriaAndorraAngolaAntigua and BarbudaArab WorldArgentinaArmeniaArubaAustriaAzerbaijanBahamas, TheBahrainBangladeshBelarusBelgiumBelizeBeninBermudaBhutanBoliviaBosnia and HerzegovinaBotswanaBrazilBritish Virgin IslandsBrunei DarussalamBulgariaBurkina FasoBurundiCabo VerdeCambodiaCameroonCanadaCaribbean small statesCayman IslandsCentral African RepublicCentral Europe and the BalticsChadChileChinaColombiaComorosCongo, Dem. Rep.Congo, Rep.Costa RicaCote d'IvoireCroatiaCubaCyprusCzech RepublicDenmarkDjiboutiDominicaDominican RepublicEarly-demographic dividendEast Asia & PacificEast Asia & Pacific (excluding high income)East Asia & Pacific (IDA & IBRD countries)EcuadorEgypt, Arab Rep.El SalvadorEquatorial GuineaEritreaEstoniaEthiopiaEuro areaEurope & Central AsiaEurope & Central Asia (excluding high income)Europe & Central Asia (IDA & IBRD countries)European UnionFijiFinlandFragile and conflict affected situationsFranceGabonGambia, TheGeorgiaGermanyGhanaGreeceGrenadaGuatemalaGuineaGuinea-BissauGuyanaHaitiHeavily indebted poor countries (HIPC)High incomeHondurasHong Kong SAR, ChinaHungaryIBRD onlyIcelandIDA & IBRD totalIDA blendIDA onlyIDA totalIndiaIndonesiaIran, Islamic Rep.IraqIrelandIsraelItalyJamaicaJapanJordanKazakhstanKenyaKiribatiKorea, Rep.KuwaitKyrgyz RepublicLao PDRLate-demographic dividendLatin America & Caribbean Latin America & Caribbean (excluding high income)Latin America & the Caribbean (IDA & IBRD countries)LatviaLeast developed countries: UN classificationLebanonLesothoLiberiaLibyaLiechtensteinLithuaniaLow & middle incomeLow incomeLower middle incomeLuxembourgMacao SAR, ChinaMacedonia, FYRMadagascarMalawiMalaysiaMaldivesMaliMaltaMauritaniaMauritiusMexicoMiddle East & North AfricaMiddle East & North Africa (excluding high income)Middle East & North Africa (IDA & IBRD countries)Middle incomeMoldovaMonacoMongoliaMontenegroMoroccoMozambiqueMyanmarNamibiaNauruNepalNetherlandsNew ZealandNicaraguaNigerNorwayOECD membersOmanOther small statesPacific island small statesPakistanPalauPanamaPapua New GuineaParaguayPeruPhilippinesPolandPortugalPost-demographic dividendPre-demographic dividendQatarRomaniaRussian FederationRwandaSamoaSan MarinoSao Tome and PrincipeSaudi ArabiaSenegalSerbiaSeychellesSierra LeoneSingaporeSint Maarten (Dutch part)Slovak RepublicSloveniaSmall statesSolomon IslandsSomaliaSouth AfricaSouth AsiaSouth Asia (IDA & IBRD)South SudanSpainSri LankaSt. Kitts and NevisSt. LuciaSt. Vincent and the GrenadinesSub-Saharan Africa Sub-Saharan Africa (excluding high income)Sub-Saharan Africa (IDA & IBRD countries)SudanSurinameSwazilandSwedenSwitzerlandSyrian Arab RepublicTajikistanTanzaniaThailandTimor-LesteTogoTongaTrinidad and TobagoTunisiaTurkeyTurks and Caicos IslandsTuvaluUgandaUkraineUnited Arab EmiratesUnited KingdomUpper middle incomeUruguayUzbekistanVanuatuVenezuela, RBVietnamWest Bank and GazaWorldYemen, Rep.ZambiaZimbabwe Timeline:
This timeline shows a graph from 1973 to 2015 of Algeria. No data until 1972. Number of actual observations by date: 42.
Source name:
World Development Indicators
Source organization:
UNESCO Institute for Statistics
Categories, topics:
Education, Gender
Last updated:
apr 23, 2017
Indicators value changes by year
Maximum:
17.172
jan 1, 2001
At the date of observation
Value
Absolute change
Change from previous value
jan 1, 1973
12.407
+12.407
0.0%
jan 1, 1974
12.654
+0.247
1.99%
jan 1, 1975
12.695
+0.041
0.32%
jan 1, 1976
12.796
+0.102
0.8%
jan 1, 1977
12.862
+0.065
0.51%
jan 1, 1978
12.552
-0.31
-2.41%
jan 1, 1979
13.558
+1.006
8.01%
jan 1, 1980
13.542
-0.016
-0.12%
jan 1, 1981
13.554
+0.012
0.09%
jan 1, 1982
12.413
-1.141
-8.42%
jan 1, 1983
11.108
-1.305
-10.51%
jan 1, 1984
7.399
-3.709
-33.39%
jan 1, 1985
7.585
+0.186
2.51%
jan 1, 1986
7.647
+0.062
0.82%
jan 1, 1987
8.716
+1.069
13.99%
jan 1, 1988
7.79
-0.926
-10.63%
jan 1, 1989
7.632
-0.158
-2.03%
jan 1, 1990
7.702
+0.07
0.92%
jan 1, 1991
8.137
+0.434
5.64%
jan 1, 1992
11.114
+2.977
36.59%
jan 1, 1993
10.5
-0.614
-5.52%
jan 1, 1994
11.039
+0.539
5.13%
jan 1, 1995
11.079
+0.04
0.36%
jan 1, 1996
10.953
-0.125
-1.13%
jan 1, 1997
10.743
-0.21
-1.92%
jan 1, 1998
12.952
+2.209
20.57%
jan 1, 2000
14.629
+1.677
12.95%
jan 1, 2001
17.172
+2.543
17.38%
jan 1, 2002
15.186
-1.987
-11.57%
jan 1, 2003
14.151
-1.034
-6.81%
jan 1, 2004
14.051
-0.101
-0.71%
jan 1, 2005
14.342
+0.291
2.07%
jan 1, 2006
13.624
-0.718
-5.01%
jan 1, 2007
14.415
+0.791
5.81%
jan 1, 2008
13.568
-0.847
-5.88%
jan 1, 2009
9.534
-4.035
-29.74%
jan 1, 2010
13.087
+3.554
37.28%
jan 1, 2011
9.16
-3.928
-30.01%
jan 1, 2012
9.204
+0.044
0.48%
jan 1, 2013
8.634
-0.57
-6.19%
jan 1, 2014
8.516
-0.118
-1.36%
jan 1, 2015
8.612
+0.096
1.13%
Ranking of countries by current statistics by years


Comments: