29
/
en
AIzaSyAYiBZKx7MnpbEhh9jyipgxe19OcubqV5w
April 1, 2024
165308
Jordan
JOR
true
2
1
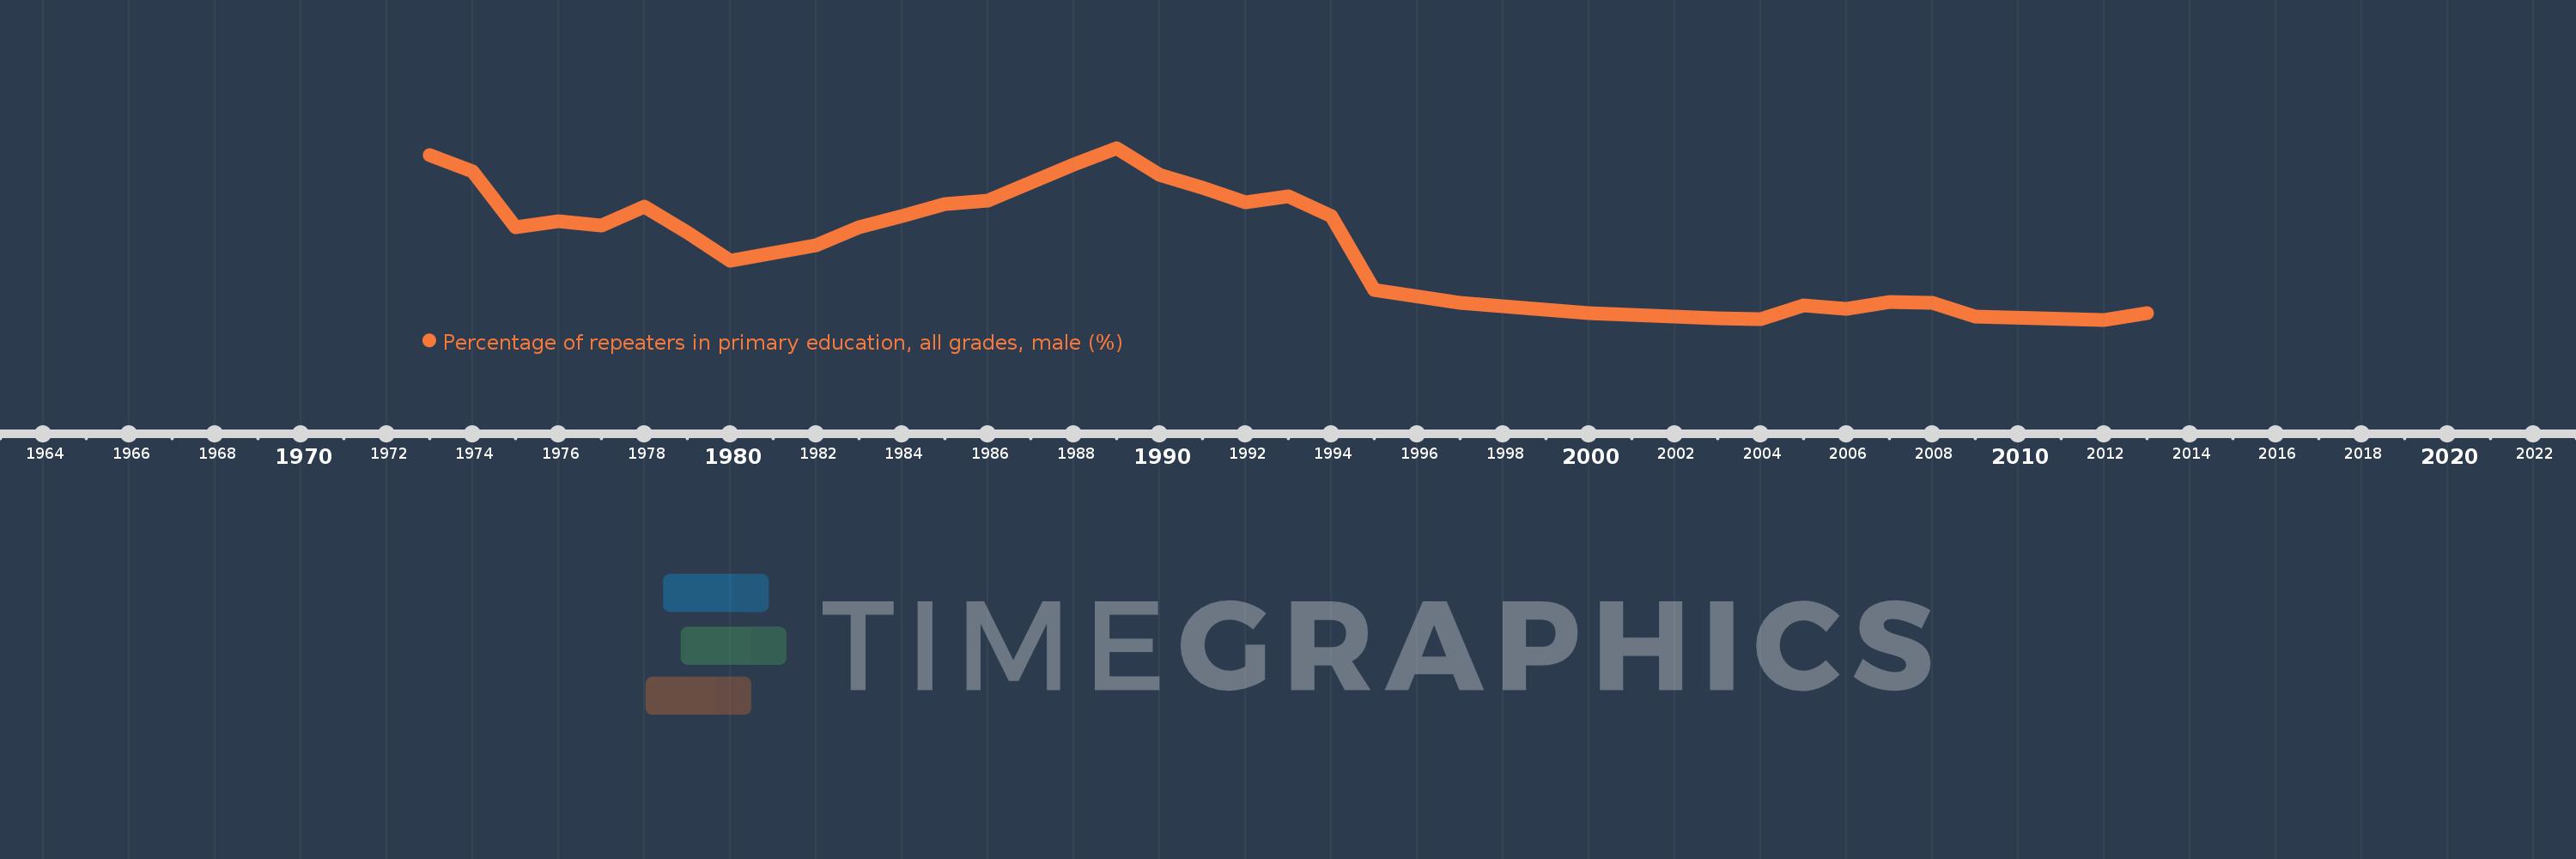
Percentage of repeaters in primary education, all grades, male (%)
2013,2012,2009,2008,2007,2006,2005,2004,2003,2001,2000,1997,1995,1994,1993,1992,1991,1990,1989,1988,1986,1985,1984,1983,1982,1981,1980,1979,1978,1977,1976,1975,1974,1973
This statistics in other country:
AfghanistanAlbaniaAlgeriaAndorraAngolaAntigua and BarbudaArab WorldArgentinaArmeniaArubaAustriaAzerbaijanBahamas, TheBahrainBangladeshBelarusBelgiumBelizeBeninBermudaBhutanBoliviaBosnia and HerzegovinaBotswanaBrazilBritish Virgin IslandsBrunei DarussalamBulgariaBurkina FasoBurundiCabo VerdeCambodiaCameroonCanadaCaribbean small statesCayman IslandsCentral African RepublicCentral Europe and the BalticsChadChileChinaColombiaComorosCongo, Dem. Rep.Congo, Rep.Costa RicaCote d'IvoireCroatiaCubaCyprusCzech RepublicDenmarkDjiboutiDominicaDominican RepublicEarly-demographic dividendEast Asia & PacificEast Asia & Pacific (excluding high income)East Asia & Pacific (IDA & IBRD countries)EcuadorEgypt, Arab Rep.El SalvadorEquatorial GuineaEritreaEstoniaEthiopiaEuro areaEurope & Central AsiaEurope & Central Asia (excluding high income)Europe & Central Asia (IDA & IBRD countries)European UnionFijiFinlandFragile and conflict affected situationsFranceGabonGambia, TheGeorgiaGermanyGhanaGreeceGrenadaGuatemalaGuineaGuinea-BissauGuyanaHaitiHeavily indebted poor countries (HIPC)High incomeHondurasHong Kong SAR, ChinaHungaryIBRD onlyIcelandIDA & IBRD totalIDA blendIDA onlyIDA totalIndiaIndonesiaIran, Islamic Rep.IraqIrelandIsraelItalyJamaicaJapanJordanKazakhstanKenyaKiribatiKorea, Rep.KuwaitKyrgyz RepublicLao PDRLate-demographic dividendLatin America & Caribbean Latin America & Caribbean (excluding high income)Latin America & the Caribbean (IDA & IBRD countries)LatviaLeast developed countries: UN classificationLebanonLesothoLiberiaLibyaLiechtensteinLithuaniaLow & middle incomeLow incomeLower middle incomeLuxembourgMacao SAR, ChinaMacedonia, FYRMadagascarMalawiMalaysiaMaldivesMaliMaltaMauritaniaMauritiusMexicoMiddle East & North AfricaMiddle East & North Africa (excluding high income)Middle East & North Africa (IDA & IBRD countries)Middle incomeMoldovaMonacoMongoliaMontenegroMoroccoMozambiqueMyanmarNamibiaNauruNepalNetherlandsNew ZealandNicaraguaNigerNorwayOECD membersOmanOther small statesPacific island small statesPakistanPalauPanamaPapua New GuineaParaguayPeruPhilippinesPolandPortugalPost-demographic dividendPre-demographic dividendQatarRomaniaRussian FederationRwandaSamoaSan MarinoSao Tome and PrincipeSaudi ArabiaSenegalSerbiaSeychellesSierra LeoneSingaporeSint Maarten (Dutch part)Slovak RepublicSloveniaSmall statesSolomon IslandsSomaliaSouth AfricaSouth AsiaSouth Asia (IDA & IBRD)South SudanSpainSri LankaSt. Kitts and NevisSt. LuciaSt. Vincent and the GrenadinesSub-Saharan Africa Sub-Saharan Africa (excluding high income)Sub-Saharan Africa (IDA & IBRD countries)SudanSurinameSwazilandSwedenSwitzerlandSyrian Arab RepublicTajikistanTanzaniaThailandTimor-LesteTogoTongaTrinidad and TobagoTunisiaTurkeyTurks and Caicos IslandsTuvaluUgandaUkraineUnited Arab EmiratesUnited KingdomUpper middle incomeUruguayUzbekistanVanuatuVenezuela, RBVietnamWest Bank and GazaWorldYemen, Rep.ZambiaZimbabwe Timeline:
This timeline shows a graph from 1973 to 2013 of Jordan. No data until 1972. Number of actual observations by date: 34.
Source name:
World Development Indicators
Source organization:
UNESCO Institute for Statistics
Categories, topics:
Education, Gender
Last updated:
apr 23, 2017
Indicators value changes by year
At the date of observation
Value
Absolute change
Change from previous value
jan 1, 1973
6.577
+6.577
0.0%
jan 1, 1974
5.96
-0.617
-9.38%
jan 1, 1975
3.881
-2.08
-34.89%
jan 1, 1976
4.104
+0.224
5.76%
jan 1, 1977
3.959
-0.146
-3.55%
jan 1, 1978
4.658
+0.699
17.66%
jan 1, 1979
3.707
-0.951
-20.42%
jan 1, 1980
2.636
-1.071
-28.89%
jan 1, 1981
2.942
+0.306
11.62%
jan 1, 1982
3.207
+0.265
9.01%
jan 1, 1983
3.902
+0.695
21.68%
jan 1, 1984
4.296
+0.394
10.1%
jan 1, 1985
4.748
+0.451
10.51%
jan 1, 1986
4.897
+0.149
3.13%
jan 1, 1988
6.221
+1.325
27.05%
jan 1, 1989
6.844
+0.622
10.01%
jan 1, 1990
5.851
-0.993
-14.51%
jan 1, 1991
5.357
-0.493
-8.43%
jan 1, 1992
4.807
-0.551
-10.28%
jan 1, 1993
5.03
+0.223
4.64%
jan 1, 1994
4.32
-0.71
-14.11%
jan 1, 1995
1.553
-2.767
-64.05%
jan 1, 1997
1.084
-0.469
-30.2%
jan 1, 2000
0.69
-0.394
-36.35%
jan 1, 2001
0.64
-0.05
-7.24%
jan 1, 2003
0.495
-0.145
-22.63%
jan 1, 2004
0.476
-0.019
-3.83%
jan 1, 2005
0.967
+0.491
103.01%
jan 1, 2006
0.855
-0.112
-11.55%
jan 1, 2007
1.106
+0.251
29.35%
jan 1, 2008
1.068
-0.038
-3.41%
jan 1, 2009
0.571
-0.498
-46.58%
jan 1, 2012
0.445
-0.126
-22.09%
jan 1, 2013
0.69
+0.245
55.06%
Ranking of countries by current statistics by years


Comments: