29
/
en
AIzaSyAYiBZKx7MnpbEhh9jyipgxe19OcubqV5w
April 1, 2024
261375
Tanzania
TZA
true
2
1
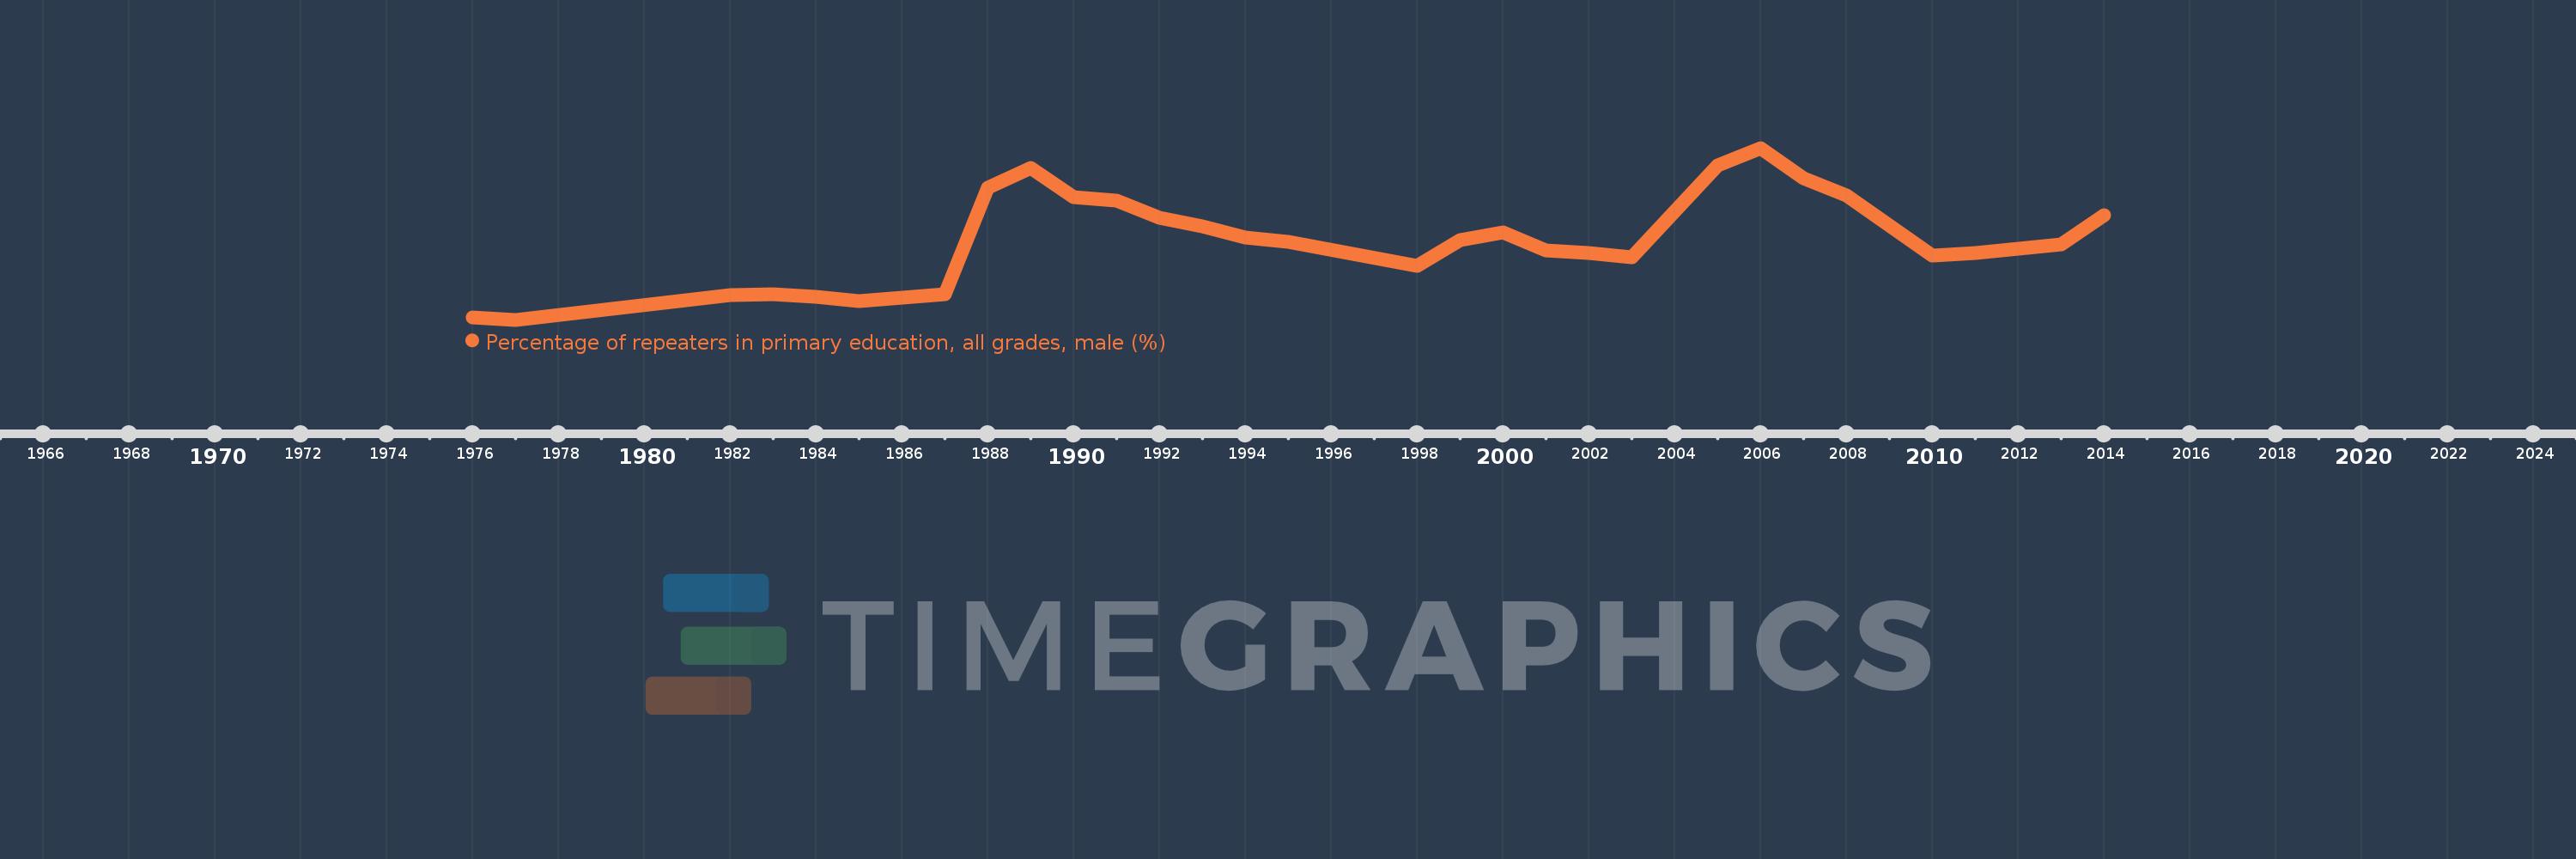
Percentage of repeaters in primary education, all grades, male (%)
2014,2013,2011,2010,2008,2007,2006,2005,2003,2002,2001,2000,1999,1998,1995,1994,1993,1992,1991,1990,1989,1988,1987,1985,1984,1983,1982,1977,1976
This statistics in other country:
AfghanistanAlbaniaAlgeriaAndorraAngolaAntigua and BarbudaArab WorldArgentinaArmeniaArubaAustriaAzerbaijanBahamas, TheBahrainBangladeshBelarusBelgiumBelizeBeninBermudaBhutanBoliviaBosnia and HerzegovinaBotswanaBrazilBritish Virgin IslandsBrunei DarussalamBulgariaBurkina FasoBurundiCabo VerdeCambodiaCameroonCanadaCaribbean small statesCayman IslandsCentral African RepublicCentral Europe and the BalticsChadChileChinaColombiaComorosCongo, Dem. Rep.Congo, Rep.Costa RicaCote d'IvoireCroatiaCubaCyprusCzech RepublicDenmarkDjiboutiDominicaDominican RepublicEarly-demographic dividendEast Asia & PacificEast Asia & Pacific (excluding high income)East Asia & Pacific (IDA & IBRD countries)EcuadorEgypt, Arab Rep.El SalvadorEquatorial GuineaEritreaEstoniaEthiopiaEuro areaEurope & Central AsiaEurope & Central Asia (excluding high income)Europe & Central Asia (IDA & IBRD countries)European UnionFijiFinlandFragile and conflict affected situationsFranceGabonGambia, TheGeorgiaGermanyGhanaGreeceGrenadaGuatemalaGuineaGuinea-BissauGuyanaHaitiHeavily indebted poor countries (HIPC)High incomeHondurasHong Kong SAR, ChinaHungaryIBRD onlyIcelandIDA & IBRD totalIDA blendIDA onlyIDA totalIndiaIndonesiaIran, Islamic Rep.IraqIrelandIsraelItalyJamaicaJapanJordanKazakhstanKenyaKiribatiKorea, Rep.KuwaitKyrgyz RepublicLao PDRLate-demographic dividendLatin America & Caribbean Latin America & Caribbean (excluding high income)Latin America & the Caribbean (IDA & IBRD countries)LatviaLeast developed countries: UN classificationLebanonLesothoLiberiaLibyaLiechtensteinLithuaniaLow & middle incomeLow incomeLower middle incomeLuxembourgMacao SAR, ChinaMacedonia, FYRMadagascarMalawiMalaysiaMaldivesMaliMaltaMauritaniaMauritiusMexicoMiddle East & North AfricaMiddle East & North Africa (excluding high income)Middle East & North Africa (IDA & IBRD countries)Middle incomeMoldovaMonacoMongoliaMontenegroMoroccoMozambiqueMyanmarNamibiaNauruNepalNetherlandsNew ZealandNicaraguaNigerNorwayOECD membersOmanOther small statesPacific island small statesPakistanPalauPanamaPapua New GuineaParaguayPeruPhilippinesPolandPortugalPost-demographic dividendPre-demographic dividendQatarRomaniaRussian FederationRwandaSamoaSan MarinoSao Tome and PrincipeSaudi ArabiaSenegalSerbiaSeychellesSierra LeoneSingaporeSint Maarten (Dutch part)Slovak RepublicSloveniaSmall statesSolomon IslandsSomaliaSouth AfricaSouth AsiaSouth Asia (IDA & IBRD)South SudanSpainSri LankaSt. Kitts and NevisSt. LuciaSt. Vincent and the GrenadinesSub-Saharan Africa Sub-Saharan Africa (excluding high income)Sub-Saharan Africa (IDA & IBRD countries)SudanSurinameSwazilandSwedenSwitzerlandSyrian Arab RepublicTajikistanTanzaniaThailandTimor-LesteTogoTongaTrinidad and TobagoTunisiaTurkeyTurks and Caicos IslandsTuvaluUgandaUkraineUnited Arab EmiratesUnited KingdomUpper middle incomeUruguayUzbekistanVanuatuVenezuela, RBVietnamWest Bank and GazaWorldYemen, Rep.ZambiaZimbabwe Timeline:
This timeline shows a graph from 1976 to 2014 of Tanzania. No data until 1975. Number of actual observations by date: 29.
Source name:
World Development Indicators
Source organization:
UNESCO Institute for Statistics
Categories, topics:
Education, Gender
Last updated:
apr 23, 2017
Indicators value changes by year
At the date of observation
Value
Absolute change
Change from previous value
jan 1, 1976
0.53
+0.53
0.0%
jan 1, 1977
0.463
-0.067
-12.66%
jan 1, 1982
1.209
+0.746
161.11%
jan 1, 1983
1.252
+0.043
3.56%
jan 1, 1984
1.157
-0.095
-7.62%
jan 1, 1985
1.044
-0.113
-9.73%
jan 1, 1987
1.235
+0.19
18.23%
jan 1, 1988
4.5
+3.265
264.41%
jan 1, 1989
5.125
+0.625
13.9%
jan 1, 1990
4.229
-0.896
-17.48%
jan 1, 1991
4.119
-0.11
-2.61%
jan 1, 1992
3.581
-0.538
-13.06%
jan 1, 1993
3.328
-0.252
-7.04%
jan 1, 1994
2.975
-0.354
-10.63%
jan 1, 1995
2.855
-0.119
-4.0%
jan 1, 1998
2.103
-0.752
-26.35%
jan 1, 1999
2.895
+0.791
37.63%
jan 1, 2000
3.15
+0.255
8.81%
jan 1, 2001
2.584
-0.566
-17.96%
jan 1, 2002
2.501
-0.083
-3.2%
jan 1, 2003
2.368
-0.133
-5.33%
jan 1, 2005
5.189
+2.821
119.14%
jan 1, 2006
5.725
+0.536
10.32%
jan 1, 2007
4.795
-0.93
-16.25%
jan 1, 2008
4.259
-0.536
-11.18%
jan 1, 2010
2.439
-1.82
-42.73%
jan 1, 2011
2.514
+0.075
3.06%
jan 1, 2013
2.759
+0.245
9.75%
jan 1, 2014
3.67
+0.912
33.04%
Ranking of countries by current statistics by years


Comments: