29
/
en
AIzaSyAYiBZKx7MnpbEhh9jyipgxe19OcubqV5w
April 1, 2024
39341
IDA only
IDX
false
2
1
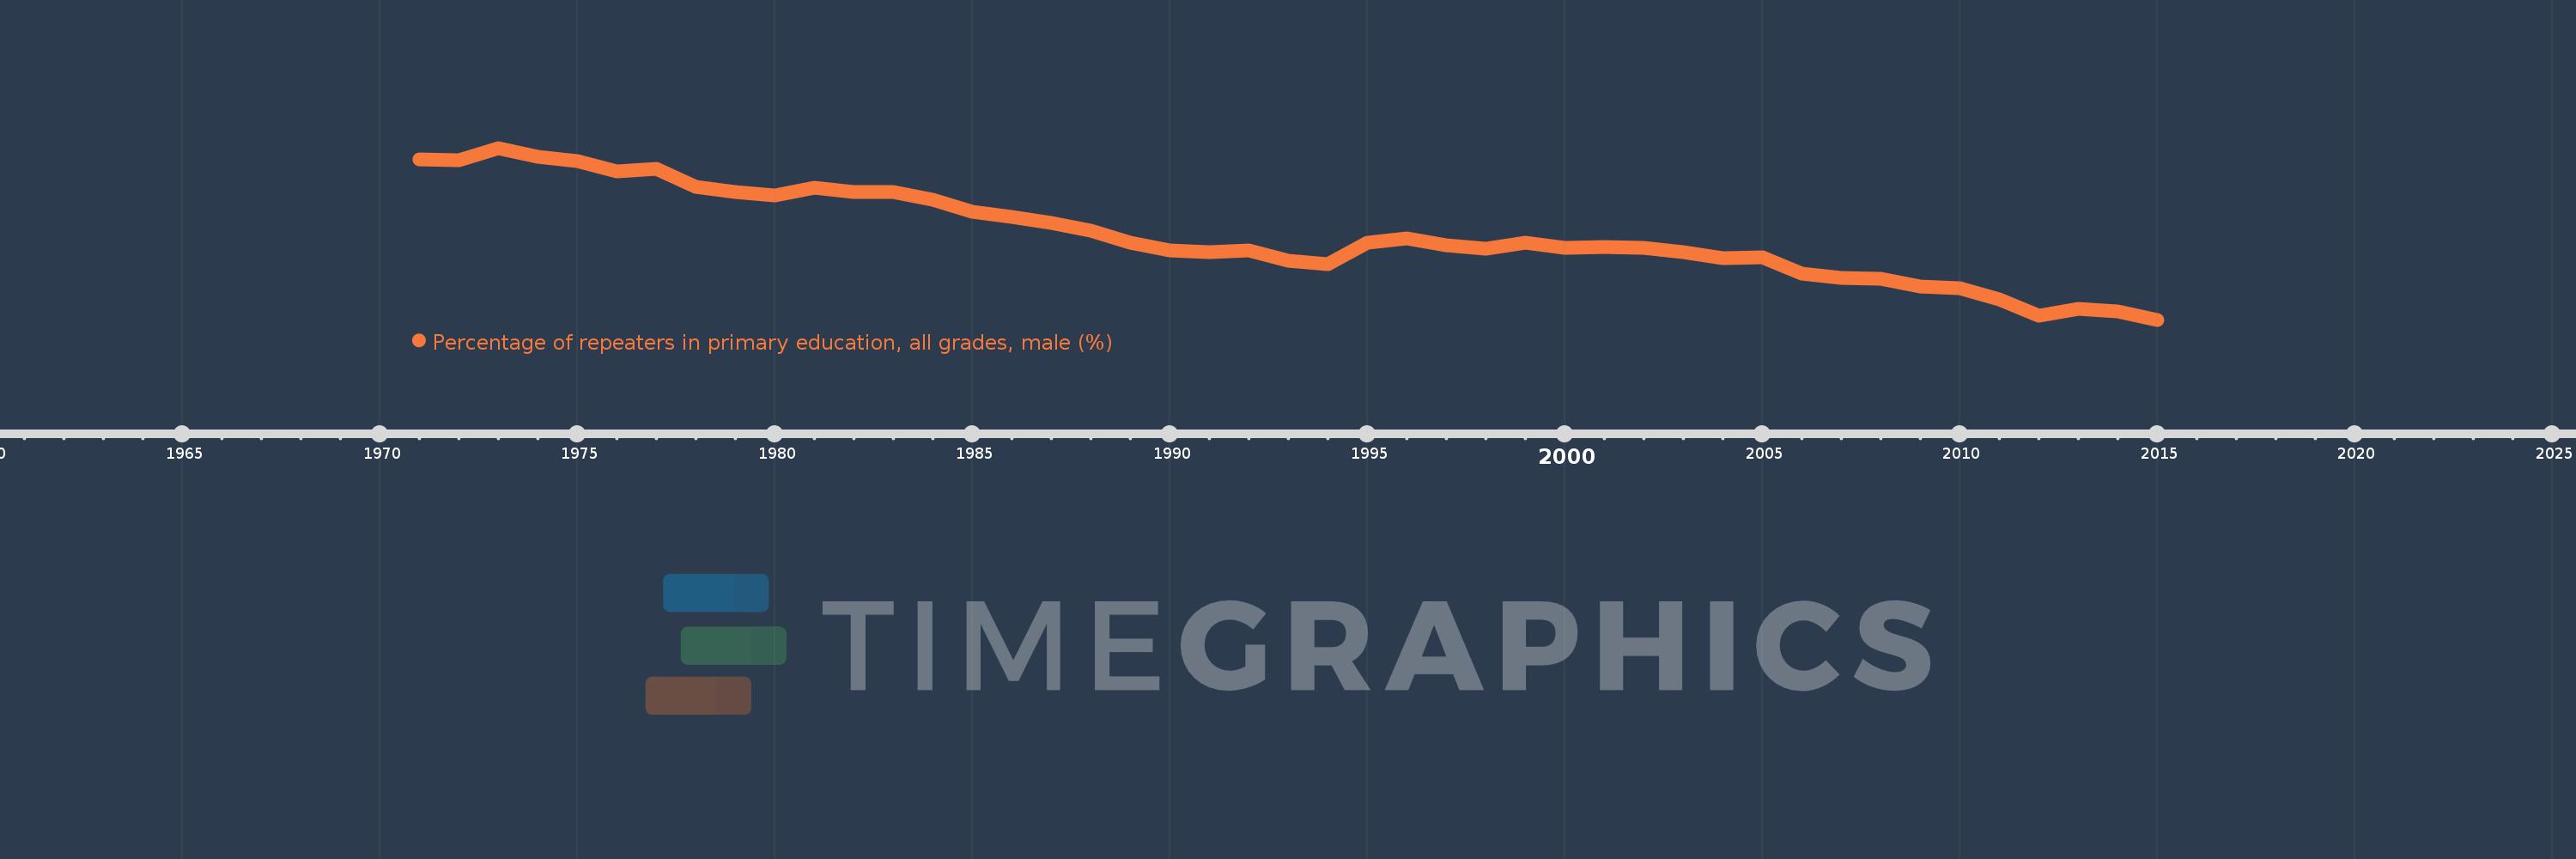
Percentage of repeaters in primary education, all grades, male (%)
2015,2014,2013,2012,2011,2010,2009,2008,2007,2006,2005,2004,2003,2002,2001,2000,1999,1998,1997,1996,1995,1994,1993,1992,1991,1990,1989,1988,1987,1986,1985,1984,1983,1982,1981,1980,1979,1978,1977,1976,1975,1974,1973,1972,1971
This statistics in other country:
AfghanistanAlbaniaAlgeriaAndorraAngolaAntigua and BarbudaArab WorldArgentinaArmeniaArubaAustriaAzerbaijanBahamas, TheBahrainBangladeshBelarusBelgiumBelizeBeninBermudaBhutanBoliviaBosnia and HerzegovinaBotswanaBrazilBritish Virgin IslandsBrunei DarussalamBulgariaBurkina FasoBurundiCabo VerdeCambodiaCameroonCanadaCaribbean small statesCayman IslandsCentral African RepublicCentral Europe and the BalticsChadChileChinaColombiaComorosCongo, Dem. Rep.Congo, Rep.Costa RicaCote d'IvoireCroatiaCubaCyprusCzech RepublicDenmarkDjiboutiDominicaDominican RepublicEarly-demographic dividendEast Asia & PacificEast Asia & Pacific (excluding high income)East Asia & Pacific (IDA & IBRD countries)EcuadorEgypt, Arab Rep.El SalvadorEquatorial GuineaEritreaEstoniaEthiopiaEuro areaEurope & Central AsiaEurope & Central Asia (excluding high income)Europe & Central Asia (IDA & IBRD countries)European UnionFijiFinlandFragile and conflict affected situationsFranceGabonGambia, TheGeorgiaGermanyGhanaGreeceGrenadaGuatemalaGuineaGuinea-BissauGuyanaHaitiHeavily indebted poor countries (HIPC)High incomeHondurasHong Kong SAR, ChinaHungaryIBRD onlyIcelandIDA & IBRD totalIDA blendIDA onlyIDA totalIndiaIndonesiaIran, Islamic Rep.IraqIrelandIsraelItalyJamaicaJapanJordanKazakhstanKenyaKiribatiKorea, Rep.KuwaitKyrgyz RepublicLao PDRLate-demographic dividendLatin America & Caribbean Latin America & Caribbean (excluding high income)Latin America & the Caribbean (IDA & IBRD countries)LatviaLeast developed countries: UN classificationLebanonLesothoLiberiaLibyaLiechtensteinLithuaniaLow & middle incomeLow incomeLower middle incomeLuxembourgMacao SAR, ChinaMacedonia, FYRMadagascarMalawiMalaysiaMaldivesMaliMaltaMauritaniaMauritiusMexicoMiddle East & North AfricaMiddle East & North Africa (excluding high income)Middle East & North Africa (IDA & IBRD countries)Middle incomeMoldovaMonacoMongoliaMontenegroMoroccoMozambiqueMyanmarNamibiaNauruNepalNetherlandsNew ZealandNicaraguaNigerNorwayOECD membersOmanOther small statesPacific island small statesPakistanPalauPanamaPapua New GuineaParaguayPeruPhilippinesPolandPortugalPost-demographic dividendPre-demographic dividendQatarRomaniaRussian FederationRwandaSamoaSan MarinoSao Tome and PrincipeSaudi ArabiaSenegalSerbiaSeychellesSierra LeoneSingaporeSint Maarten (Dutch part)Slovak RepublicSloveniaSmall statesSolomon IslandsSomaliaSouth AfricaSouth AsiaSouth Asia (IDA & IBRD)South SudanSpainSri LankaSt. Kitts and NevisSt. LuciaSt. Vincent and the GrenadinesSub-Saharan Africa Sub-Saharan Africa (excluding high income)Sub-Saharan Africa (IDA & IBRD countries)SudanSurinameSwazilandSwedenSwitzerlandSyrian Arab RepublicTajikistanTanzaniaThailandTimor-LesteTogoTongaTrinidad and TobagoTunisiaTurkeyTurks and Caicos IslandsTuvaluUgandaUkraineUnited Arab EmiratesUnited KingdomUpper middle incomeUruguayUzbekistanVanuatuVenezuela, RBVietnamWest Bank and GazaWorldYemen, Rep.ZambiaZimbabwe Timeline:
This timeline shows a graph from 1971 to 2015 of IDA only. No data until 1970. Number of actual observations by date: 45.
Source name:
World Development Indicators
Source organization:
UNESCO Institute for Statistics
Categories, topics:
Education, Gender
Last updated:
apr 23, 2017
Indicators value changes by year
Maximum:
16.412
jan 1, 1973
At the date of observation
Value
Absolute change
Change from previous value
jan 1, 1971
15.933
+15.933
0.0%
jan 1, 1972
15.896
-0.037
-0.23%
jan 1, 1973
16.412
+0.516
3.24%
jan 1, 1974
16.034
-0.377
-2.3%
jan 1, 1975
15.866
-0.168
-1.05%
jan 1, 1976
15.444
-0.422
-2.66%
jan 1, 1977
15.536
+0.092
0.6%
jan 1, 1978
14.794
-0.743
-4.78%
jan 1, 1979
14.609
-0.185
-1.25%
jan 1, 1980
14.465
-0.144
-0.98%
jan 1, 1981
14.77
+0.304
2.1%
jan 1, 1982
14.577
-0.193
-1.3%
jan 1, 1983
14.61
+0.033
0.23%
jan 1, 1984
14.265
-0.345
-2.36%
jan 1, 1985
13.778
-0.487
-3.42%
jan 1, 1986
13.551
-0.227
-1.65%
jan 1, 1987
13.319
-0.232
-1.71%
jan 1, 1988
13.007
-0.311
-2.34%
jan 1, 1989
12.52
-0.487
-3.74%
jan 1, 1990
12.187
-0.333
-2.66%
jan 1, 1991
12.128
-0.059
-0.49%
jan 1, 1992
12.193
+0.065
0.54%
jan 1, 1993
11.761
-0.432
-3.54%
jan 1, 1994
11.622
-0.139
-1.18%
jan 1, 1995
12.496
+0.874
7.52%
jan 1, 1996
12.682
+0.186
1.48%
jan 1, 1997
12.388
-0.294
-2.32%
jan 1, 1998
12.272
-0.115
-0.93%
jan 1, 1999
12.5
+0.227
1.85%
jan 1, 2000
12.29
-0.21
-1.68%
jan 1, 2001
12.322
+0.032
0.26%
jan 1, 2002
12.274
-0.047
-0.38%
jan 1, 2003
12.107
-0.167
-1.36%
jan 1, 2004
11.85
-0.257
-2.13%
jan 1, 2005
11.898
+0.048
0.4%
jan 1, 2006
11.218
-0.679
-5.71%
jan 1, 2007
11.057
-0.161
-1.44%
jan 1, 2008
11.007
-0.05
-0.46%
jan 1, 2009
10.697
-0.31
-2.81%
jan 1, 2010
10.608
-0.089
-0.83%
jan 1, 2011
10.167
-0.441
-4.16%
jan 1, 2012
9.48
-0.688
-6.76%
jan 1, 2013
9.773
+0.293
3.09%
jan 1, 2014
9.681
-0.091
-0.93%
jan 1, 2015
9.324
-0.357
-3.69%
Ranking of countries by current statistics by years


Comments: