29
/
en
AIzaSyAYiBZKx7MnpbEhh9jyipgxe19OcubqV5w
April 1, 2024
111394
Congo, Rep.
COG
true
2
1
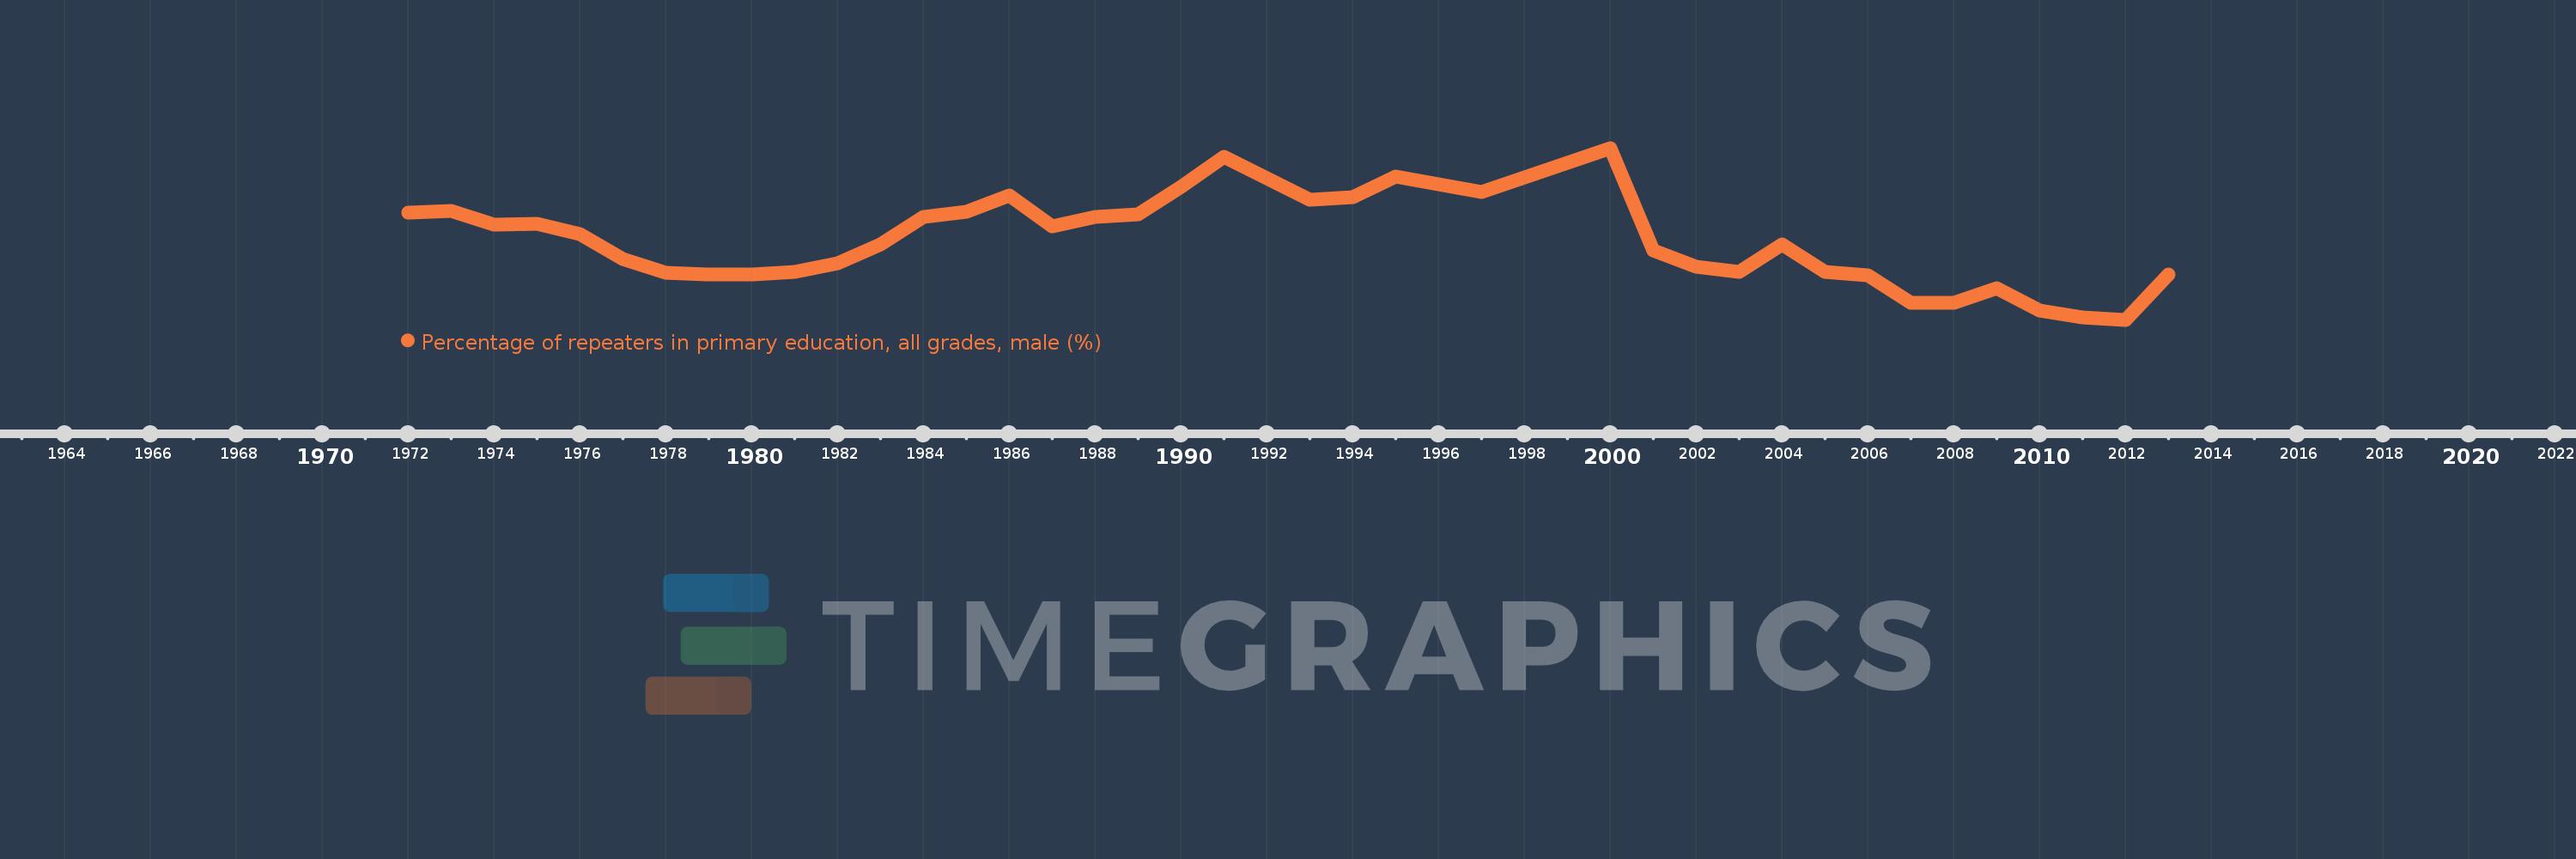
Percentage of repeaters in primary education, all grades, male (%)
2013,2012,2011,2010,2009,2008,2007,2006,2005,2004,2003,2002,2001,2000,1997,1995,1994,1993,1991,1990,1989,1988,1987,1986,1985,1984,1983,1982,1981,1980,1979,1978,1977,1976,1975,1974,1973,1972
This statistics in other country:
AfghanistanAlbaniaAlgeriaAndorraAngolaAntigua and BarbudaArab WorldArgentinaArmeniaArubaAustriaAzerbaijanBahamas, TheBahrainBangladeshBelarusBelgiumBelizeBeninBermudaBhutanBoliviaBosnia and HerzegovinaBotswanaBrazilBritish Virgin IslandsBrunei DarussalamBulgariaBurkina FasoBurundiCabo VerdeCambodiaCameroonCanadaCaribbean small statesCayman IslandsCentral African RepublicCentral Europe and the BalticsChadChileChinaColombiaComorosCongo, Dem. Rep.Congo, Rep.Costa RicaCote d'IvoireCroatiaCubaCyprusCzech RepublicDenmarkDjiboutiDominicaDominican RepublicEarly-demographic dividendEast Asia & PacificEast Asia & Pacific (excluding high income)East Asia & Pacific (IDA & IBRD countries)EcuadorEgypt, Arab Rep.El SalvadorEquatorial GuineaEritreaEstoniaEthiopiaEuro areaEurope & Central AsiaEurope & Central Asia (excluding high income)Europe & Central Asia (IDA & IBRD countries)European UnionFijiFinlandFragile and conflict affected situationsFranceGabonGambia, TheGeorgiaGermanyGhanaGreeceGrenadaGuatemalaGuineaGuinea-BissauGuyanaHaitiHeavily indebted poor countries (HIPC)High incomeHondurasHong Kong SAR, ChinaHungaryIBRD onlyIcelandIDA & IBRD totalIDA blendIDA onlyIDA totalIndiaIndonesiaIran, Islamic Rep.IraqIrelandIsraelItalyJamaicaJapanJordanKazakhstanKenyaKiribatiKorea, Rep.KuwaitKyrgyz RepublicLao PDRLate-demographic dividendLatin America & Caribbean Latin America & Caribbean (excluding high income)Latin America & the Caribbean (IDA & IBRD countries)LatviaLeast developed countries: UN classificationLebanonLesothoLiberiaLibyaLiechtensteinLithuaniaLow & middle incomeLow incomeLower middle incomeLuxembourgMacao SAR, ChinaMacedonia, FYRMadagascarMalawiMalaysiaMaldivesMaliMaltaMauritaniaMauritiusMexicoMiddle East & North AfricaMiddle East & North Africa (excluding high income)Middle East & North Africa (IDA & IBRD countries)Middle incomeMoldovaMonacoMongoliaMontenegroMoroccoMozambiqueMyanmarNamibiaNauruNepalNetherlandsNew ZealandNicaraguaNigerNorwayOECD membersOmanOther small statesPacific island small statesPakistanPalauPanamaPapua New GuineaParaguayPeruPhilippinesPolandPortugalPost-demographic dividendPre-demographic dividendQatarRomaniaRussian FederationRwandaSamoaSan MarinoSao Tome and PrincipeSaudi ArabiaSenegalSerbiaSeychellesSierra LeoneSingaporeSint Maarten (Dutch part)Slovak RepublicSloveniaSmall statesSolomon IslandsSomaliaSouth AfricaSouth AsiaSouth Asia (IDA & IBRD)South SudanSpainSri LankaSt. Kitts and NevisSt. LuciaSt. Vincent and the GrenadinesSub-Saharan Africa Sub-Saharan Africa (excluding high income)Sub-Saharan Africa (IDA & IBRD countries)SudanSurinameSwazilandSwedenSwitzerlandSyrian Arab RepublicTajikistanTanzaniaThailandTimor-LesteTogoTongaTrinidad and TobagoTunisiaTurkeyTurks and Caicos IslandsTuvaluUgandaUkraineUnited Arab EmiratesUnited KingdomUpper middle incomeUruguayUzbekistanVanuatuVenezuela, RBVietnamWest Bank and GazaWorldYemen, Rep.ZambiaZimbabwe Timeline:
This timeline shows a graph from 1972 to 2013 of Congo, Rep.. No data until 1971. Number of actual observations by date: 38.
Source name:
World Development Indicators
Source organization:
UNESCO Institute for Statistics
Categories, topics:
Education, Gender
Last updated:
apr 23, 2017
Indicators value changes by year
Minimum:
19.406
jan 1, 2012
Maximum:
39.966
jan 1, 2000
At the date of observation
Value
Absolute change
Change from previous value
jan 1, 1972
32.239
+32.239
0.0%
jan 1, 1973
32.452
+0.212
0.66%
jan 1, 1974
30.77
-1.681
-5.18%
jan 1, 1975
30.922
+0.152
0.49%
jan 1, 1976
29.686
-1.236
-4.0%
jan 1, 1977
26.661
-3.026
-10.19%
jan 1, 1978
25.035
-1.625
-6.1%
jan 1, 1979
24.864
-0.172
-0.69%
jan 1, 1980
24.866
+0.003
0.01%
jan 1, 1981
25.132
+0.266
1.07%
jan 1, 1982
26.161
+1.029
4.09%
jan 1, 1983
28.457
+2.295
8.77%
jan 1, 1984
31.713
+3.256
11.44%
jan 1, 1985
32.357
+0.645
2.03%
jan 1, 1986
34.319
+1.962
6.06%
jan 1, 1987
30.601
-3.718
-10.83%
jan 1, 1988
31.739
+1.138
3.72%
jan 1, 1989
31.987
+0.248
0.78%
jan 1, 1990
35.336
+3.349
10.47%
jan 1, 1991
38.907
+3.571
10.11%
jan 1, 1993
33.774
-5.133
-13.19%
jan 1, 1994
34.11
+0.336
0.99%
jan 1, 1995
36.556
+2.446
7.17%
jan 1, 1997
34.719
-1.837
-5.02%
jan 1, 2000
39.966
+5.247
15.11%
jan 1, 2001
27.681
-12.285
-30.74%
jan 1, 2002
25.731
-1.95
-7.04%
jan 1, 2003
25.1
-0.632
-2.46%
jan 1, 2004
28.414
+3.314
13.2%
jan 1, 2005
25.133
-3.281
-11.55%
jan 1, 2006
24.711
-0.422
-1.68%
jan 1, 2007
21.471
-3.24
-13.11%
jan 1, 2008
21.478
+0.008
0.04%
jan 1, 2009
23.217
+1.738
8.09%
jan 1, 2010
20.513
-2.704
-11.65%
jan 1, 2011
19.701
-0.811
-3.96%
jan 1, 2012
19.406
-0.296
-1.5%
jan 1, 2013
24.776
+5.37
27.67%
Ranking of countries by current statistics by years


Comments: