29
/
en
AIzaSyAYiBZKx7MnpbEhh9jyipgxe19OcubqV5w
April 1, 2024
286350
Zambia
ZMB
true
2
1
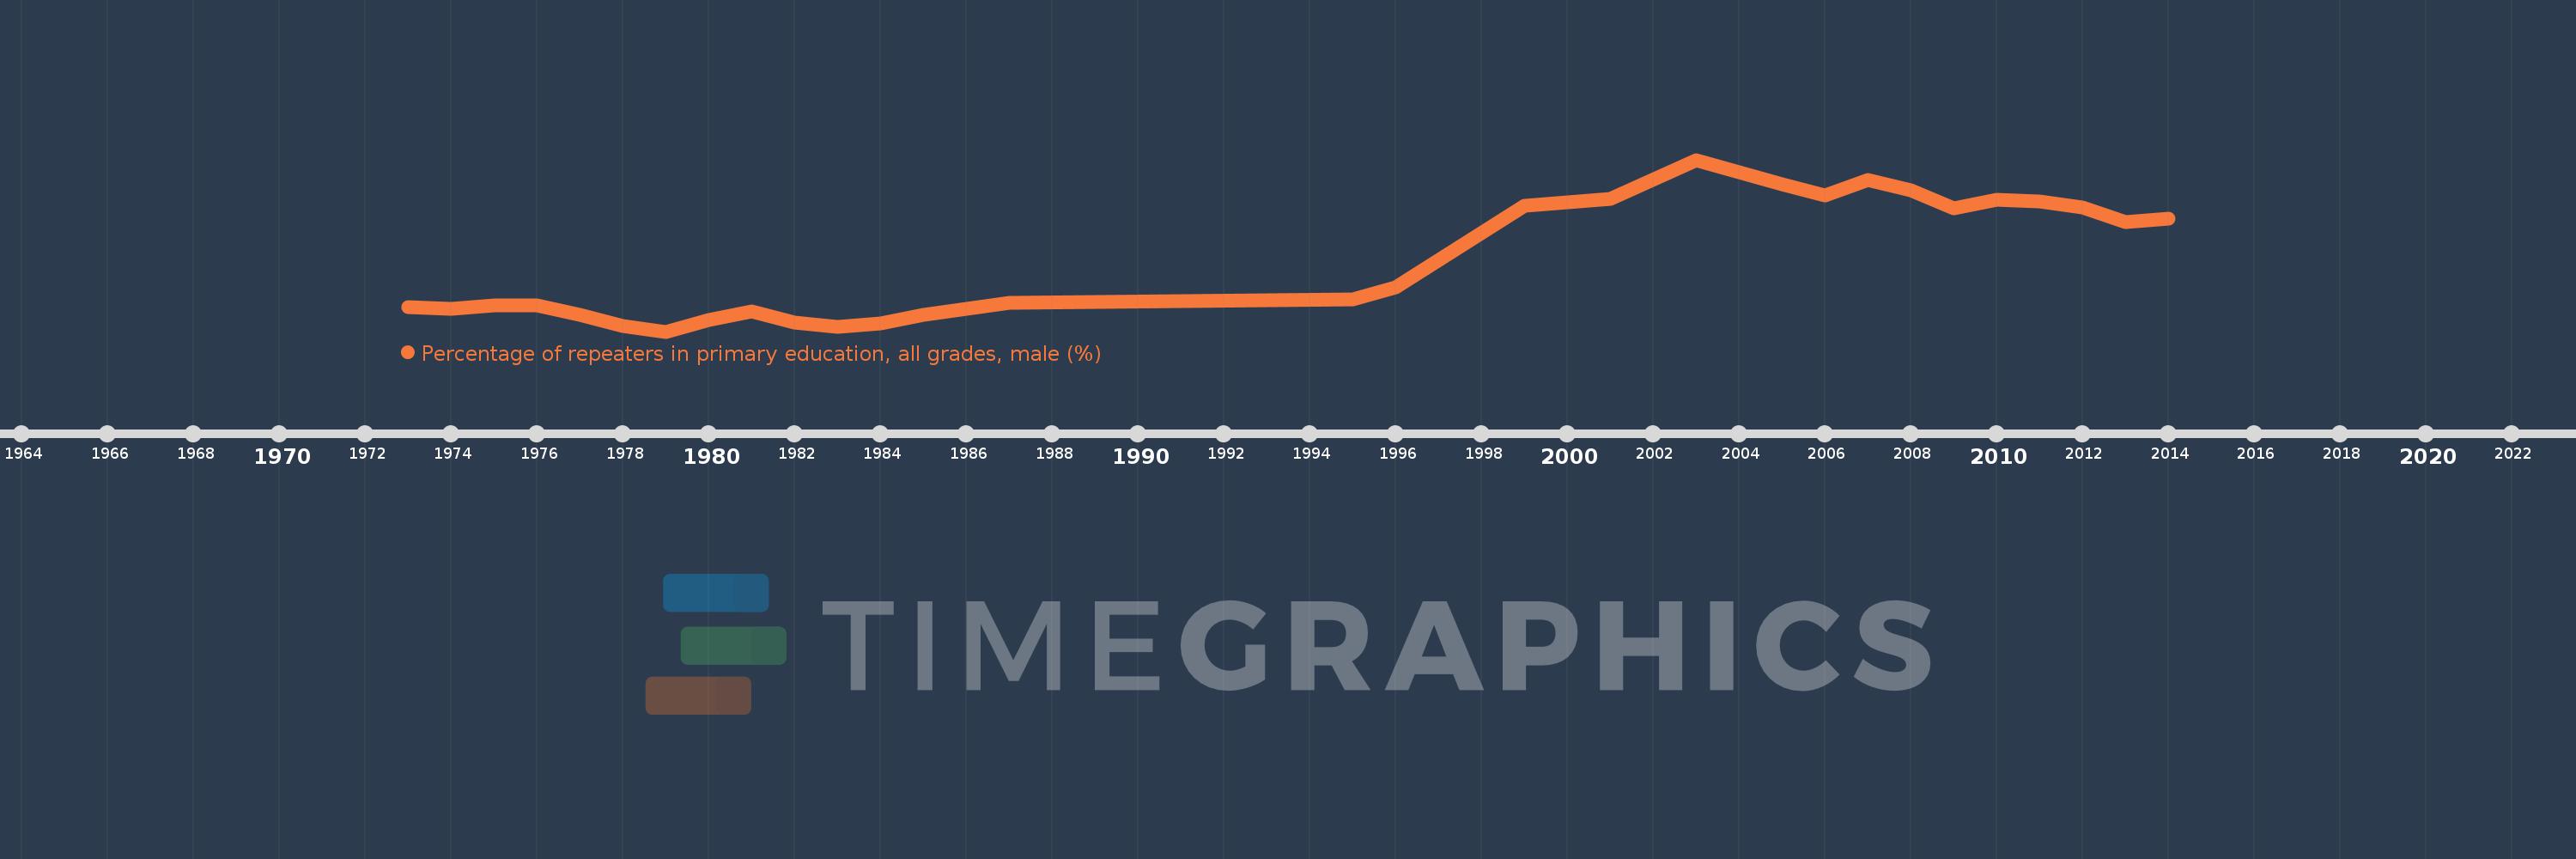
Percentage of repeaters in primary education, all grades, male (%)
2014,2013,2012,2011,2010,2009,2008,2007,2006,2005,2003,2001,2000,1999,1996,1995,1987,1985,1984,1983,1982,1981,1980,1979,1978,1977,1976,1975,1974,1973
This statistics in other country:
AfghanistanAlbaniaAlgeriaAndorraAngolaAntigua and BarbudaArab WorldArgentinaArmeniaArubaAustriaAzerbaijanBahamas, TheBahrainBangladeshBelarusBelgiumBelizeBeninBermudaBhutanBoliviaBosnia and HerzegovinaBotswanaBrazilBritish Virgin IslandsBrunei DarussalamBulgariaBurkina FasoBurundiCabo VerdeCambodiaCameroonCanadaCaribbean small statesCayman IslandsCentral African RepublicCentral Europe and the BalticsChadChileChinaColombiaComorosCongo, Dem. Rep.Congo, Rep.Costa RicaCote d'IvoireCroatiaCubaCyprusCzech RepublicDenmarkDjiboutiDominicaDominican RepublicEarly-demographic dividendEast Asia & PacificEast Asia & Pacific (excluding high income)East Asia & Pacific (IDA & IBRD countries)EcuadorEgypt, Arab Rep.El SalvadorEquatorial GuineaEritreaEstoniaEthiopiaEuro areaEurope & Central AsiaEurope & Central Asia (excluding high income)Europe & Central Asia (IDA & IBRD countries)European UnionFijiFinlandFragile and conflict affected situationsFranceGabonGambia, TheGeorgiaGermanyGhanaGreeceGrenadaGuatemalaGuineaGuinea-BissauGuyanaHaitiHeavily indebted poor countries (HIPC)High incomeHondurasHong Kong SAR, ChinaHungaryIBRD onlyIcelandIDA & IBRD totalIDA blendIDA onlyIDA totalIndiaIndonesiaIran, Islamic Rep.IraqIrelandIsraelItalyJamaicaJapanJordanKazakhstanKenyaKiribatiKorea, Rep.KuwaitKyrgyz RepublicLao PDRLate-demographic dividendLatin America & Caribbean Latin America & Caribbean (excluding high income)Latin America & the Caribbean (IDA & IBRD countries)LatviaLeast developed countries: UN classificationLebanonLesothoLiberiaLibyaLiechtensteinLithuaniaLow & middle incomeLow incomeLower middle incomeLuxembourgMacao SAR, ChinaMacedonia, FYRMadagascarMalawiMalaysiaMaldivesMaliMaltaMauritaniaMauritiusMexicoMiddle East & North AfricaMiddle East & North Africa (excluding high income)Middle East & North Africa (IDA & IBRD countries)Middle incomeMoldovaMonacoMongoliaMontenegroMoroccoMozambiqueMyanmarNamibiaNauruNepalNetherlandsNew ZealandNicaraguaNigerNorwayOECD membersOmanOther small statesPacific island small statesPakistanPalauPanamaPapua New GuineaParaguayPeruPhilippinesPolandPortugalPost-demographic dividendPre-demographic dividendQatarRomaniaRussian FederationRwandaSamoaSan MarinoSao Tome and PrincipeSaudi ArabiaSenegalSerbiaSeychellesSierra LeoneSingaporeSint Maarten (Dutch part)Slovak RepublicSloveniaSmall statesSolomon IslandsSomaliaSouth AfricaSouth AsiaSouth Asia (IDA & IBRD)South SudanSpainSri LankaSt. Kitts and NevisSt. LuciaSt. Vincent and the GrenadinesSub-Saharan Africa Sub-Saharan Africa (excluding high income)Sub-Saharan Africa (IDA & IBRD countries)SudanSurinameSwazilandSwedenSwitzerlandSyrian Arab RepublicTajikistanTanzaniaThailandTimor-LesteTogoTongaTrinidad and TobagoTunisiaTurkeyTurks and Caicos IslandsTuvaluUgandaUkraineUnited Arab EmiratesUnited KingdomUpper middle incomeUruguayUzbekistanVanuatuVenezuela, RBVietnamWest Bank and GazaWorldYemen, Rep.ZambiaZimbabwe Timeline:
This timeline shows a graph from 1973 to 2014 of Zambia. No data until 1972. Number of actual observations by date: 30.
Source name:
World Development Indicators
Source organization:
UNESCO Institute for Statistics
Categories, topics:
Education, Gender
Last updated:
apr 23, 2017
Indicators value changes by year
At the date of observation
Value
Absolute change
Change from previous value
jan 1, 1973
2.249
+2.249
0.0%
jan 1, 1974
2.177
-0.072
-3.21%
jan 1, 1975
2.294
+0.117
5.36%
jan 1, 1976
2.304
+0.01
0.44%
jan 1, 1977
1.945
-0.359
-15.56%
jan 1, 1978
1.496
-0.45
-23.11%
jan 1, 1979
1.276
-0.219
-14.67%
jan 1, 1980
1.748
+0.471
36.93%
jan 1, 1981
2.07
+0.323
18.45%
jan 1, 1982
1.632
-0.439
-21.18%
jan 1, 1983
1.451
-0.181
-11.1%
jan 1, 1984
1.601
+0.15
10.36%
jan 1, 1985
1.925
+0.324
20.25%
jan 1, 1987
2.413
+0.488
25.35%
jan 1, 1995
2.558
+0.145
6.0%
jan 1, 1996
3.015
+0.457
17.87%
jan 1, 1999
6.232
+3.216
106.67%
jan 1, 2000
6.353
+0.121
1.95%
jan 1, 2001
6.475
+0.122
1.92%
jan 1, 2003
8.024
+1.549
23.93%
jan 1, 2005
7.052
-0.972
-12.11%
jan 1, 2006
6.622
-0.43
-6.09%
jan 1, 2007
7.225
+0.602
9.1%
jan 1, 2008
6.832
-0.393
-5.44%
jan 1, 2009
6.102
-0.73
-10.68%
jan 1, 2010
6.459
+0.357
5.85%
jan 1, 2011
6.377
-0.083
-1.28%
jan 1, 2012
6.151
-0.226
-3.54%
jan 1, 2013
5.562
-0.589
-9.58%
jan 1, 2014
5.703
+0.141
2.53%
Ranking of countries by current statistics by years


Comments: