29
/
en
AIzaSyAYiBZKx7MnpbEhh9jyipgxe19OcubqV5w
April 1, 2024
47507
Lower middle income
LMC
false
2
1
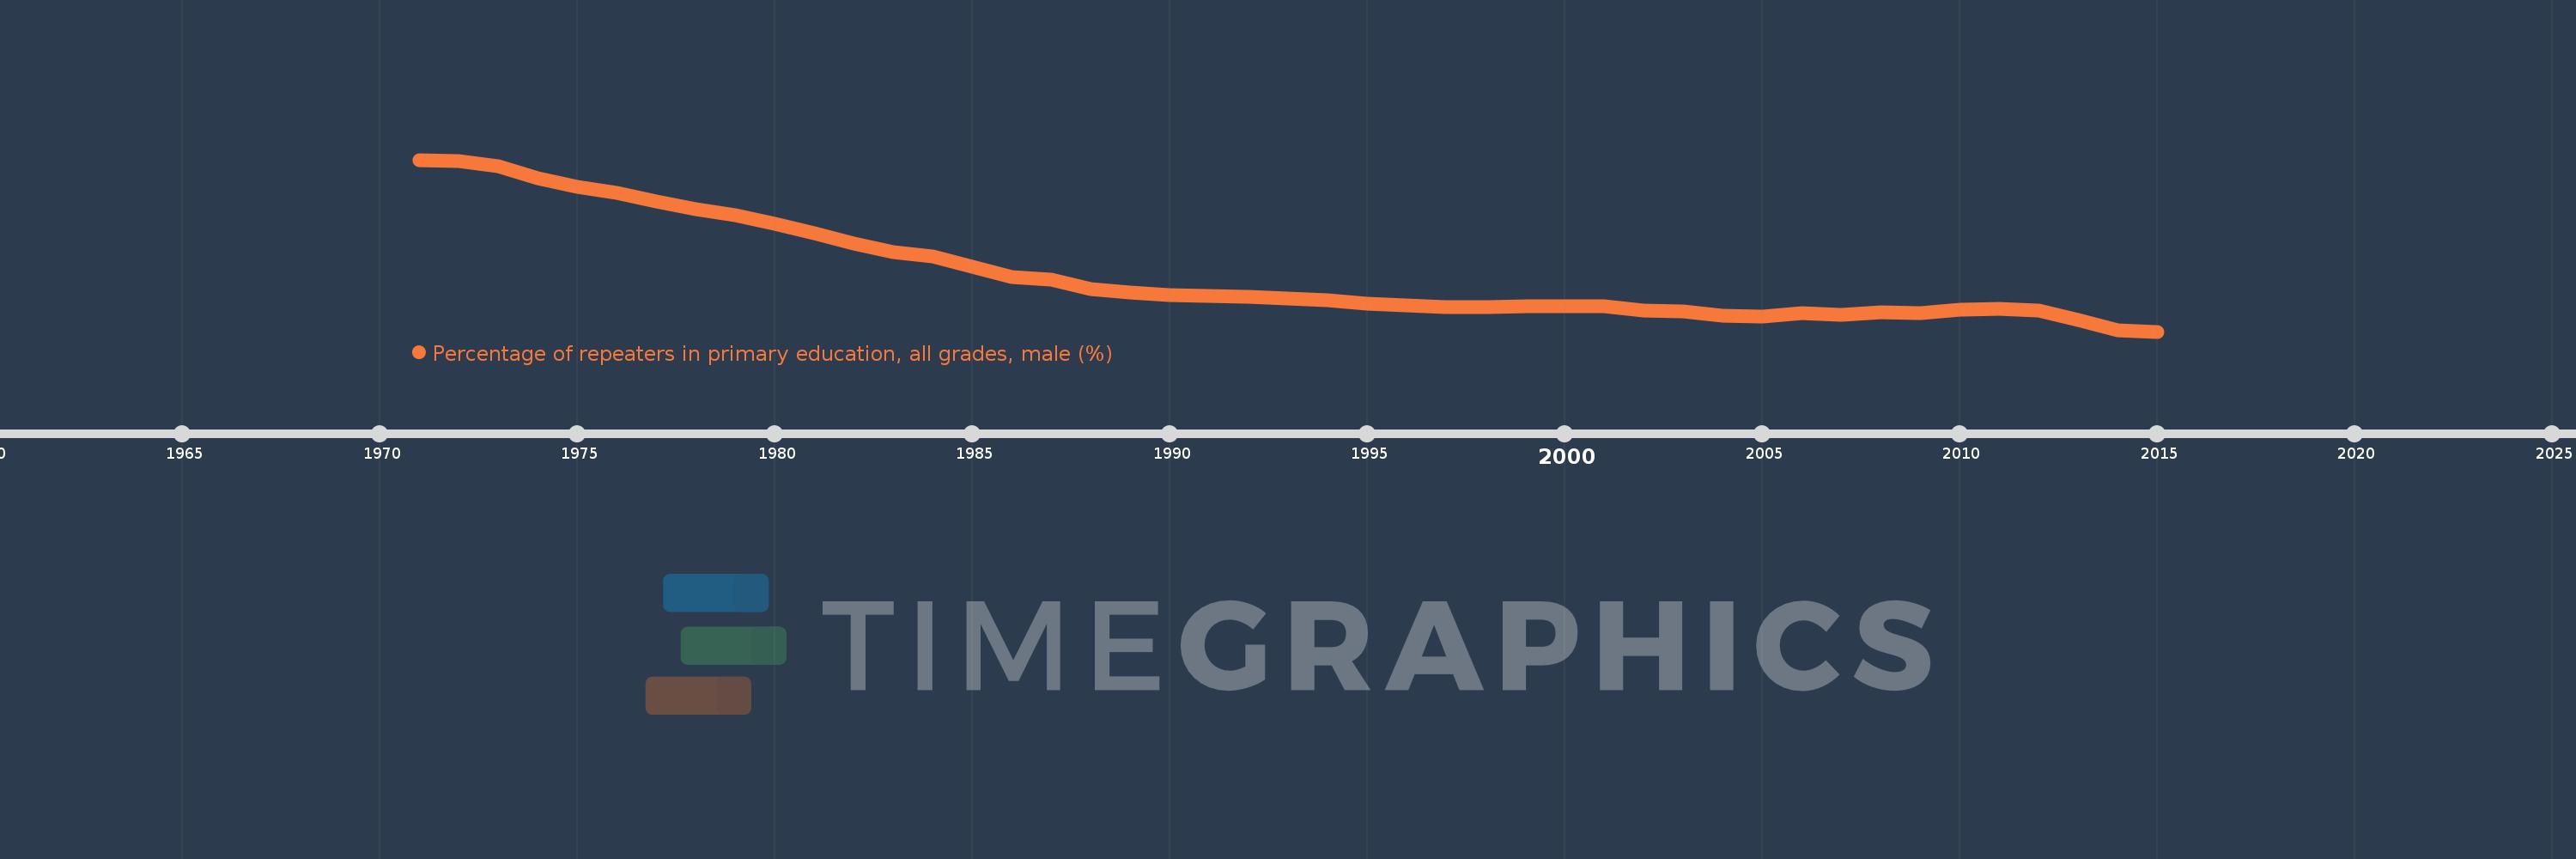
Percentage of repeaters in primary education, all grades, male (%)
2015,2014,2013,2012,2011,2010,2009,2008,2007,2006,2005,2004,2003,2002,2001,2000,1999,1998,1997,1996,1995,1994,1993,1992,1991,1990,1989,1988,1987,1986,1985,1984,1983,1982,1981,1980,1979,1978,1977,1976,1975,1974,1973,1972,1971
This statistics in other country:
AfghanistanAlbaniaAlgeriaAndorraAngolaAntigua and BarbudaArab WorldArgentinaArmeniaArubaAustriaAzerbaijanBahamas, TheBahrainBangladeshBelarusBelgiumBelizeBeninBermudaBhutanBoliviaBosnia and HerzegovinaBotswanaBrazilBritish Virgin IslandsBrunei DarussalamBulgariaBurkina FasoBurundiCabo VerdeCambodiaCameroonCanadaCaribbean small statesCayman IslandsCentral African RepublicCentral Europe and the BalticsChadChileChinaColombiaComorosCongo, Dem. Rep.Congo, Rep.Costa RicaCote d'IvoireCroatiaCubaCyprusCzech RepublicDenmarkDjiboutiDominicaDominican RepublicEarly-demographic dividendEast Asia & PacificEast Asia & Pacific (excluding high income)East Asia & Pacific (IDA & IBRD countries)EcuadorEgypt, Arab Rep.El SalvadorEquatorial GuineaEritreaEstoniaEthiopiaEuro areaEurope & Central AsiaEurope & Central Asia (excluding high income)Europe & Central Asia (IDA & IBRD countries)European UnionFijiFinlandFragile and conflict affected situationsFranceGabonGambia, TheGeorgiaGermanyGhanaGreeceGrenadaGuatemalaGuineaGuinea-BissauGuyanaHaitiHeavily indebted poor countries (HIPC)High incomeHondurasHong Kong SAR, ChinaHungaryIBRD onlyIcelandIDA & IBRD totalIDA blendIDA onlyIDA totalIndiaIndonesiaIran, Islamic Rep.IraqIrelandIsraelItalyJamaicaJapanJordanKazakhstanKenyaKiribatiKorea, Rep.KuwaitKyrgyz RepublicLao PDRLate-demographic dividendLatin America & Caribbean Latin America & Caribbean (excluding high income)Latin America & the Caribbean (IDA & IBRD countries)LatviaLeast developed countries: UN classificationLebanonLesothoLiberiaLibyaLiechtensteinLithuaniaLow & middle incomeLow incomeLower middle incomeLuxembourgMacao SAR, ChinaMacedonia, FYRMadagascarMalawiMalaysiaMaldivesMaliMaltaMauritaniaMauritiusMexicoMiddle East & North AfricaMiddle East & North Africa (excluding high income)Middle East & North Africa (IDA & IBRD countries)Middle incomeMoldovaMonacoMongoliaMontenegroMoroccoMozambiqueMyanmarNamibiaNauruNepalNetherlandsNew ZealandNicaraguaNigerNorwayOECD membersOmanOther small statesPacific island small statesPakistanPalauPanamaPapua New GuineaParaguayPeruPhilippinesPolandPortugalPost-demographic dividendPre-demographic dividendQatarRomaniaRussian FederationRwandaSamoaSan MarinoSao Tome and PrincipeSaudi ArabiaSenegalSerbiaSeychellesSierra LeoneSingaporeSint Maarten (Dutch part)Slovak RepublicSloveniaSmall statesSolomon IslandsSomaliaSouth AfricaSouth AsiaSouth Asia (IDA & IBRD)South SudanSpainSri LankaSt. Kitts and NevisSt. LuciaSt. Vincent and the GrenadinesSub-Saharan Africa Sub-Saharan Africa (excluding high income)Sub-Saharan Africa (IDA & IBRD countries)SudanSurinameSwazilandSwedenSwitzerlandSyrian Arab RepublicTajikistanTanzaniaThailandTimor-LesteTogoTongaTrinidad and TobagoTunisiaTurkeyTurks and Caicos IslandsTuvaluUgandaUkraineUnited Arab EmiratesUnited KingdomUpper middle incomeUruguayUzbekistanVanuatuVenezuela, RBVietnamWest Bank and GazaWorldYemen, Rep.ZambiaZimbabwe Timeline:
This timeline shows a graph from 1971 to 2015 of Lower middle income. No data until 1970. Number of actual observations by date: 45.
Source name:
World Development Indicators
Source organization:
UNESCO Institute for Statistics
Categories, topics:
Education, Gender
Last updated:
apr 23, 2017
Indicators value changes by year
Maximum:
15.492
jan 1, 1971
At the date of observation
Value
Absolute change
Change from previous value
jan 1, 1971
15.492
+15.492
0.0%
jan 1, 1972
15.414
-0.078
-0.51%
jan 1, 1973
15.031
-0.383
-2.49%
jan 1, 1974
14.2
-0.83
-5.52%
jan 1, 1975
13.582
-0.618
-4.35%
jan 1, 1976
13.161
-0.421
-3.1%
jan 1, 1977
12.557
-0.604
-4.59%
jan 1, 1978
11.989
-0.568
-4.52%
jan 1, 1979
11.561
-0.428
-3.57%
jan 1, 1980
10.919
-0.642
-5.55%
jan 1, 1981
10.307
-0.612
-5.6%
jan 1, 1982
9.532
-0.775
-7.52%
jan 1, 1983
8.96
-0.572
-6.0%
jan 1, 1984
8.634
-0.326
-3.63%
jan 1, 1985
7.908
-0.727
-8.42%
jan 1, 1986
7.193
-0.715
-9.04%
jan 1, 1987
6.965
-0.228
-3.17%
jan 1, 1988
6.296
-0.669
-9.61%
jan 1, 1989
6.075
-0.221
-3.51%
jan 1, 1990
5.86
-0.214
-3.53%
jan 1, 1991
5.846
-0.014
-0.24%
jan 1, 1992
5.744
-0.102
-1.75%
jan 1, 1993
5.634
-0.11
-1.91%
jan 1, 1994
5.494
-0.14
-2.49%
jan 1, 1995
5.304
-0.19
-3.45%
jan 1, 1996
5.134
-0.17
-3.21%
jan 1, 1997
5.057
-0.077
-1.5%
jan 1, 1998
5.015
-0.042
-0.83%
jan 1, 1999
5.102
+0.087
1.74%
jan 1, 2000
5.076
-0.026
-0.5%
jan 1, 2001
5.08
+0.003
0.07%
jan 1, 2002
4.813
-0.267
-5.25%
jan 1, 2003
4.699
-0.115
-2.38%
jan 1, 2004
4.403
-0.295
-6.29%
jan 1, 2005
4.33
-0.074
-1.68%
jan 1, 2006
4.603
+0.273
6.31%
jan 1, 2007
4.512
-0.09
-1.96%
jan 1, 2008
4.637
+0.125
2.77%
jan 1, 2009
4.613
-0.024
-0.53%
jan 1, 2010
4.851
+0.238
5.16%
jan 1, 2011
4.901
+0.05
1.04%
jan 1, 2012
4.785
-0.116
-2.38%
jan 1, 2013
4.128
-0.657
-13.73%
jan 1, 2014
3.369
-0.759
-18.4%
jan 1, 2015
3.292
-0.077
-2.27%
Ranking of countries by current statistics by years


Comments: