29
/
en
AIzaSyAYiBZKx7MnpbEhh9jyipgxe19OcubqV5w
April 1, 2024
36893
IBRD only
IBD
false
2
1
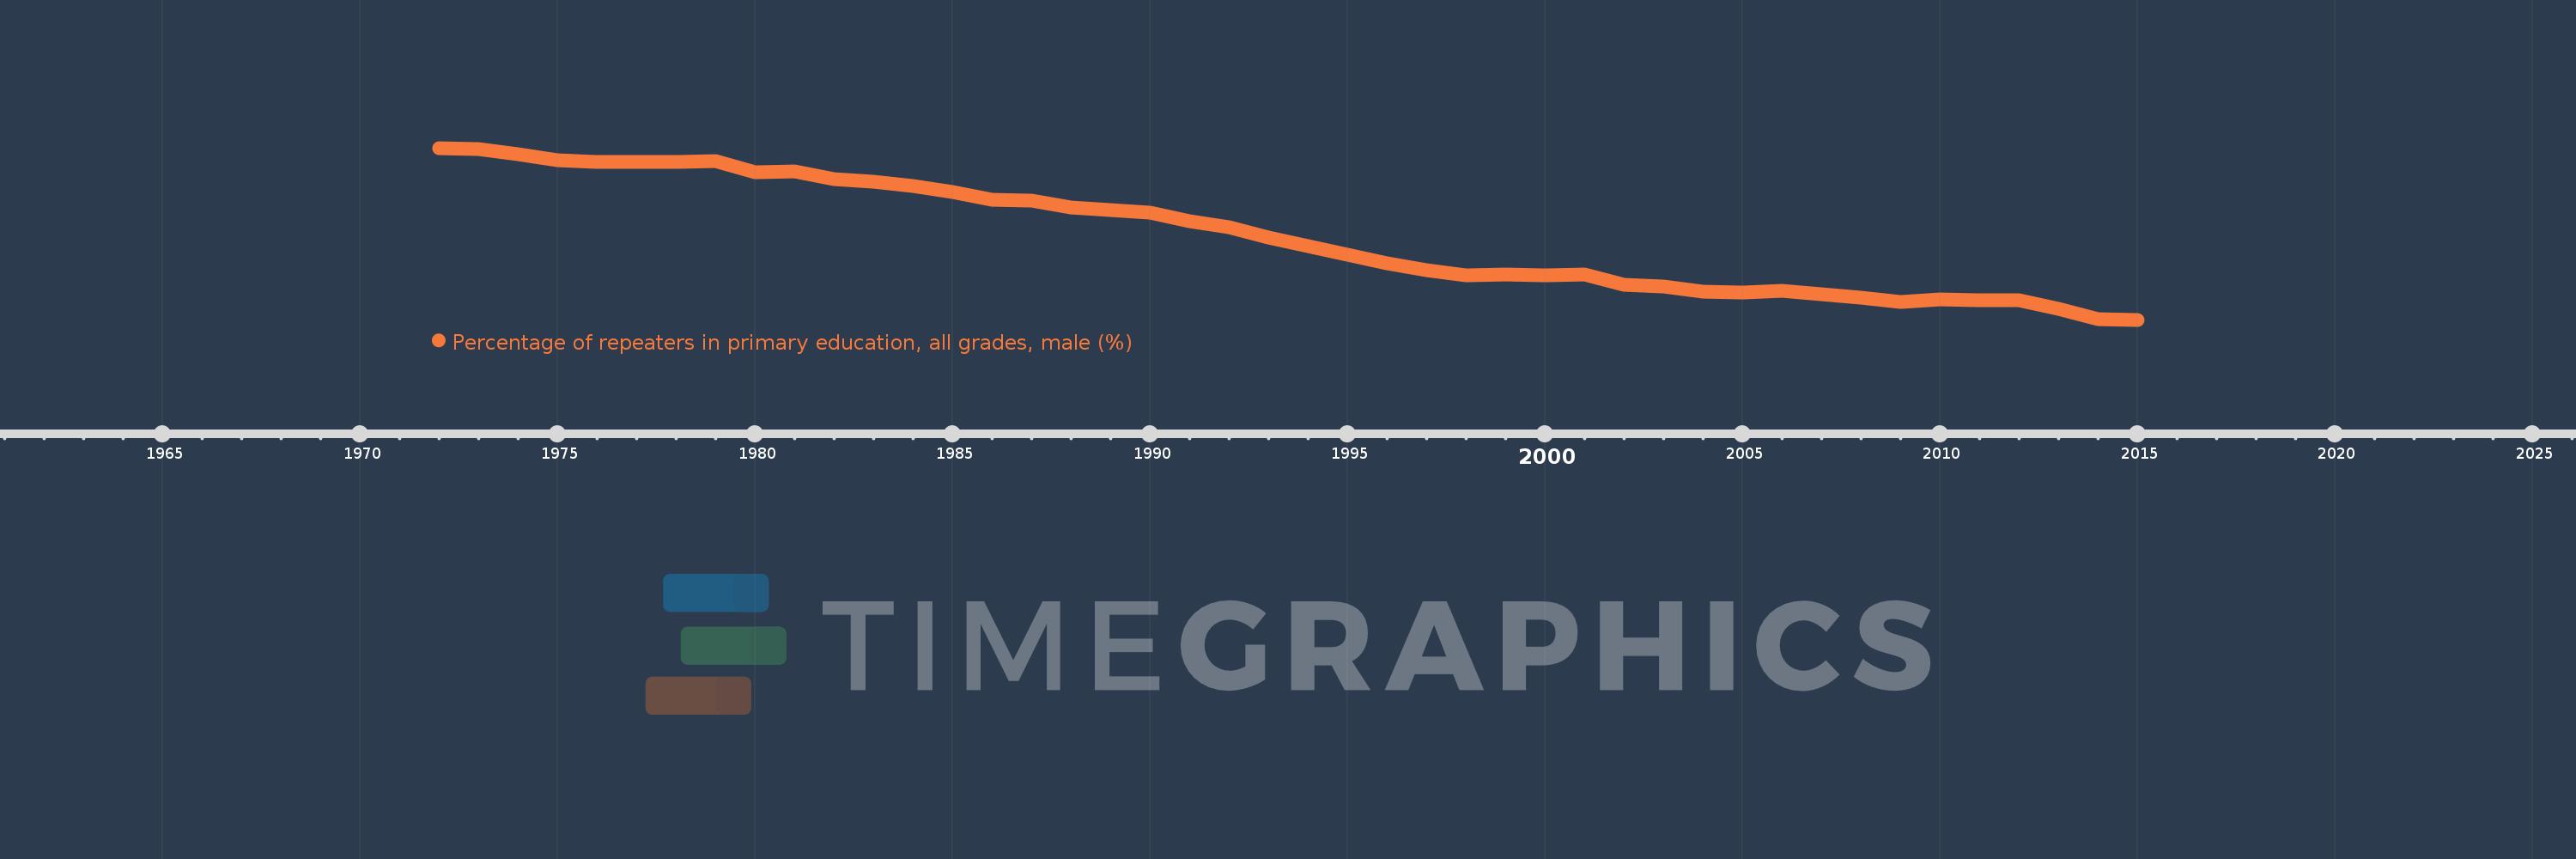
Percentage of repeaters in primary education, all grades, male (%)
2015,2014,2013,2012,2011,2010,2009,2008,2007,2006,2005,2004,2003,2002,2001,2000,1999,1998,1997,1996,1995,1994,1993,1992,1991,1990,1989,1988,1987,1986,1985,1984,1983,1982,1981,1980,1979,1978,1977,1976,1975,1974,1973,1972
This statistics in other country:
AfghanistanAlbaniaAlgeriaAndorraAngolaAntigua and BarbudaArab WorldArgentinaArmeniaArubaAustriaAzerbaijanBahamas, TheBahrainBangladeshBelarusBelgiumBelizeBeninBermudaBhutanBoliviaBosnia and HerzegovinaBotswanaBrazilBritish Virgin IslandsBrunei DarussalamBulgariaBurkina FasoBurundiCabo VerdeCambodiaCameroonCanadaCaribbean small statesCayman IslandsCentral African RepublicCentral Europe and the BalticsChadChileChinaColombiaComorosCongo, Dem. Rep.Congo, Rep.Costa RicaCote d'IvoireCroatiaCubaCyprusCzech RepublicDenmarkDjiboutiDominicaDominican RepublicEarly-demographic dividendEast Asia & PacificEast Asia & Pacific (excluding high income)East Asia & Pacific (IDA & IBRD countries)EcuadorEgypt, Arab Rep.El SalvadorEquatorial GuineaEritreaEstoniaEthiopiaEuro areaEurope & Central AsiaEurope & Central Asia (excluding high income)Europe & Central Asia (IDA & IBRD countries)European UnionFijiFinlandFragile and conflict affected situationsFranceGabonGambia, TheGeorgiaGermanyGhanaGreeceGrenadaGuatemalaGuineaGuinea-BissauGuyanaHaitiHeavily indebted poor countries (HIPC)High incomeHondurasHong Kong SAR, ChinaHungaryIBRD onlyIcelandIDA & IBRD totalIDA blendIDA onlyIDA totalIndiaIndonesiaIran, Islamic Rep.IraqIrelandIsraelItalyJamaicaJapanJordanKazakhstanKenyaKiribatiKorea, Rep.KuwaitKyrgyz RepublicLao PDRLate-demographic dividendLatin America & Caribbean Latin America & Caribbean (excluding high income)Latin America & the Caribbean (IDA & IBRD countries)LatviaLeast developed countries: UN classificationLebanonLesothoLiberiaLibyaLiechtensteinLithuaniaLow & middle incomeLow incomeLower middle incomeLuxembourgMacao SAR, ChinaMacedonia, FYRMadagascarMalawiMalaysiaMaldivesMaliMaltaMauritaniaMauritiusMexicoMiddle East & North AfricaMiddle East & North Africa (excluding high income)Middle East & North Africa (IDA & IBRD countries)Middle incomeMoldovaMonacoMongoliaMontenegroMoroccoMozambiqueMyanmarNamibiaNauruNepalNetherlandsNew ZealandNicaraguaNigerNorwayOECD membersOmanOther small statesPacific island small statesPakistanPalauPanamaPapua New GuineaParaguayPeruPhilippinesPolandPortugalPost-demographic dividendPre-demographic dividendQatarRomaniaRussian FederationRwandaSamoaSan MarinoSao Tome and PrincipeSaudi ArabiaSenegalSerbiaSeychellesSierra LeoneSingaporeSint Maarten (Dutch part)Slovak RepublicSloveniaSmall statesSolomon IslandsSomaliaSouth AfricaSouth AsiaSouth Asia (IDA & IBRD)South SudanSpainSri LankaSt. Kitts and NevisSt. LuciaSt. Vincent and the GrenadinesSub-Saharan Africa Sub-Saharan Africa (excluding high income)Sub-Saharan Africa (IDA & IBRD countries)SudanSurinameSwazilandSwedenSwitzerlandSyrian Arab RepublicTajikistanTanzaniaThailandTimor-LesteTogoTongaTrinidad and TobagoTunisiaTurkeyTurks and Caicos IslandsTuvaluUgandaUkraineUnited Arab EmiratesUnited KingdomUpper middle incomeUruguayUzbekistanVanuatuVenezuela, RBVietnamWest Bank and GazaWorldYemen, Rep.ZambiaZimbabwe Timeline:
This timeline shows a graph from 1972 to 2015 of IBRD only. No data until 1971. Number of actual observations by date: 44.
Source name:
World Development Indicators
Source organization:
UNESCO Institute for Statistics
Categories, topics:
Education, Gender
Last updated:
apr 23, 2017
Indicators value changes by year
At the date of observation
Value
Absolute change
Change from previous value
jan 1, 1972
13.34
+13.34
0.0%
jan 1, 1973
13.252
-0.089
-0.66%
jan 1, 1974
12.916
-0.336
-2.53%
jan 1, 1975
12.539
-0.377
-2.92%
jan 1, 1976
12.443
-0.096
-0.77%
jan 1, 1977
12.41
-0.033
-0.27%
jan 1, 1978
12.443
+0.033
0.27%
jan 1, 1979
12.461
+0.019
0.15%
jan 1, 1980
11.769
-0.692
-5.56%
jan 1, 1981
11.81
+0.041
0.35%
jan 1, 1982
11.324
-0.486
-4.11%
jan 1, 1983
11.121
-0.203
-1.8%
jan 1, 1984
10.871
-0.25
-2.24%
jan 1, 1985
10.476
-0.395
-3.63%
jan 1, 1986
9.941
-0.535
-5.11%
jan 1, 1987
9.908
-0.033
-0.33%
jan 1, 1988
9.469
-0.439
-4.43%
jan 1, 1989
9.3
-0.169
-1.79%
jan 1, 1990
9.108
-0.192
-2.06%
jan 1, 1991
8.564
-0.545
-5.98%
jan 1, 1992
8.192
-0.372
-4.34%
jan 1, 1993
7.493
-0.699
-8.53%
jan 1, 1994
6.945
-0.548
-7.31%
jan 1, 1995
6.366
-0.579
-8.33%
jan 1, 1996
5.835
-0.532
-8.35%
jan 1, 1997
5.39
-0.444
-7.61%
jan 1, 1998
5.058
-0.332
-6.16%
jan 1, 1999
5.08
+0.022
0.43%
jan 1, 2000
5.039
-0.041
-0.82%
jan 1, 2001
5.087
+0.048
0.96%
jan 1, 2002
4.433
-0.654
-12.85%
jan 1, 2003
4.311
-0.123
-2.77%
jan 1, 2004
4.009
-0.302
-7.0%
jan 1, 2005
3.898
-0.111
-2.76%
jan 1, 2006
4.041
+0.143
3.67%
jan 1, 2007
3.83
-0.211
-5.22%
jan 1, 2008
3.609
-0.221
-5.78%
jan 1, 2009
3.331
-0.277
-7.69%
jan 1, 2010
3.451
+0.119
3.59%
jan 1, 2011
3.425
-0.026
-0.75%
jan 1, 2012
3.397
-0.028
-0.82%
jan 1, 2013
2.854
-0.543
-15.98%
jan 1, 2014
2.187
-0.667
-23.37%
jan 1, 2015
2.152
-0.035
-1.61%
Ranking of countries by current statistics by years


Comments: