29
/
en
AIzaSyAYiBZKx7MnpbEhh9jyipgxe19OcubqV5w
April 1, 2024
100372
Cameroon
CMR
true
2
1
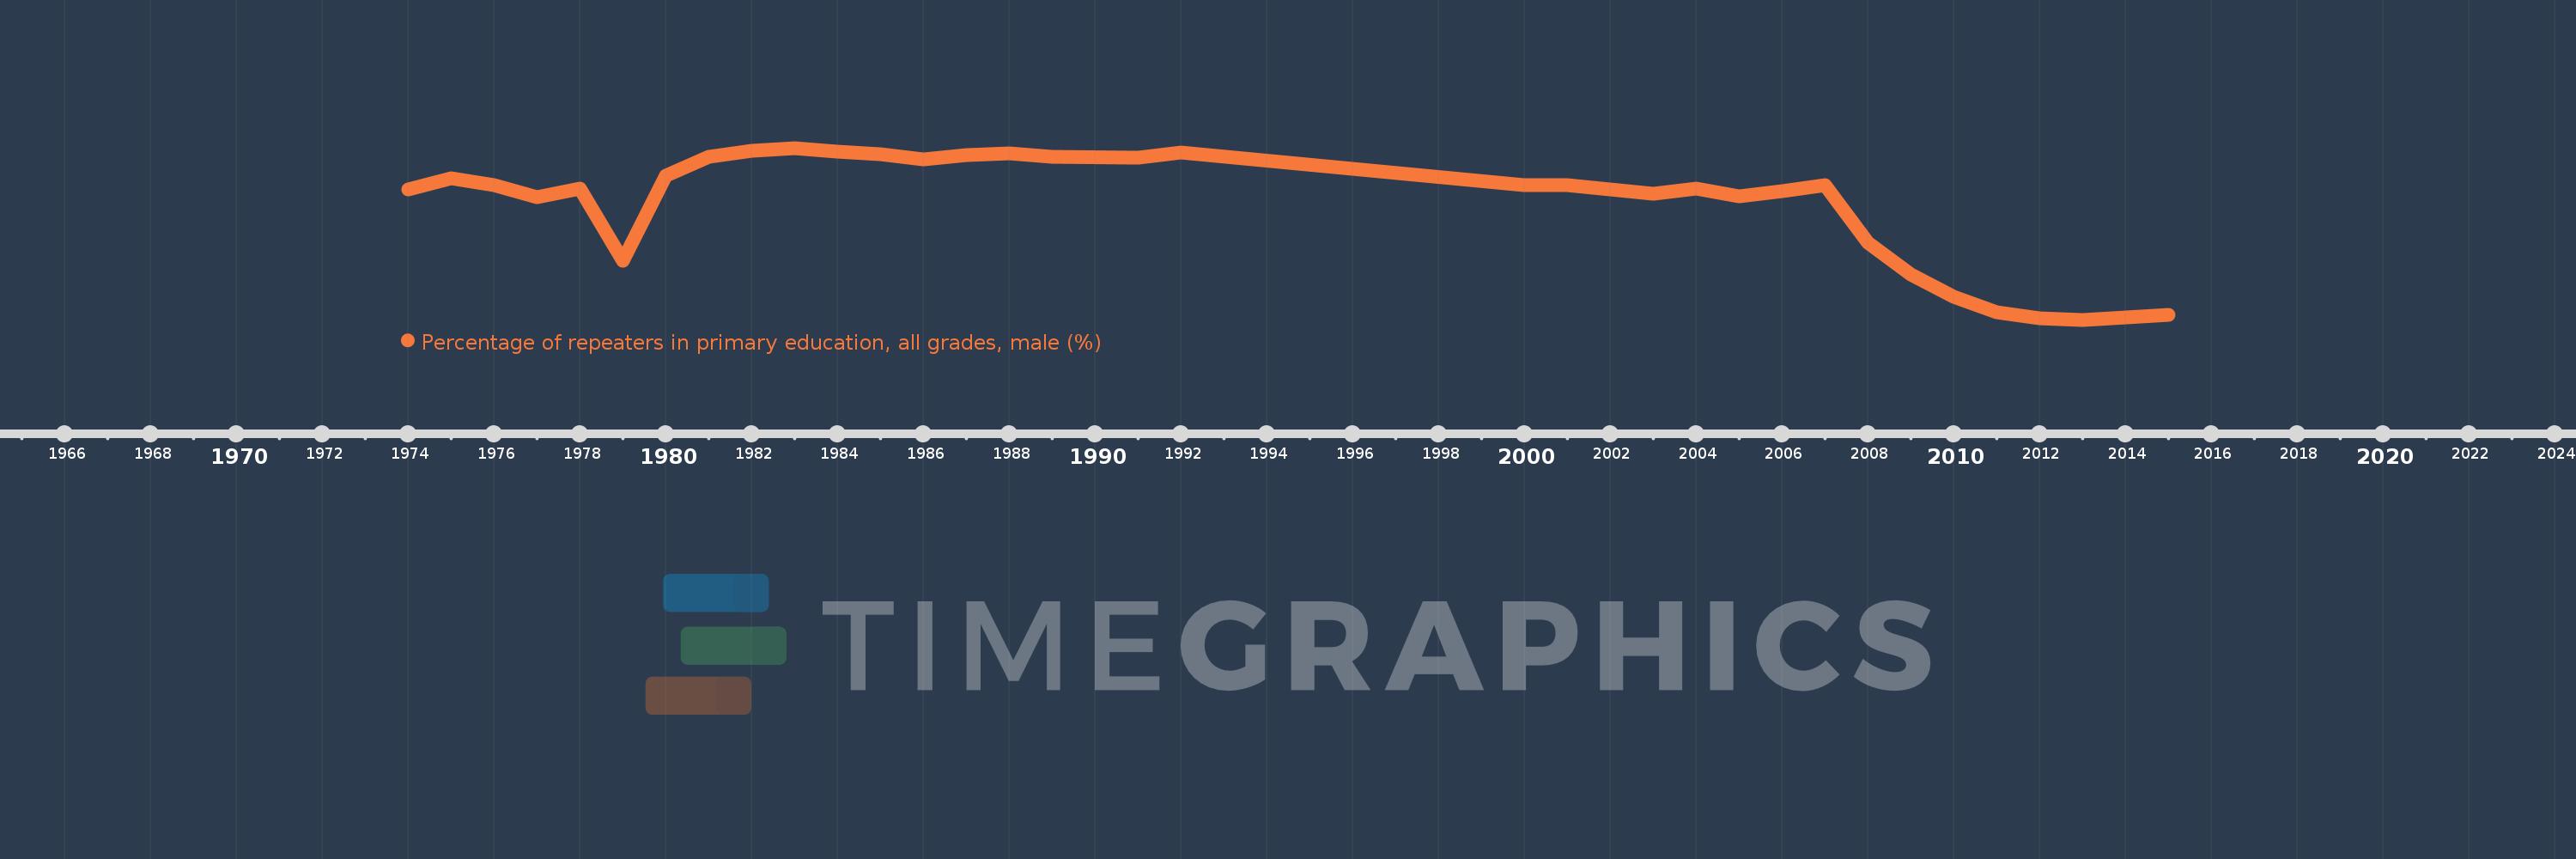
Percentage of repeaters in primary education, all grades, male (%)
2015,2013,2012,2011,2010,2009,2008,2007,2006,2005,2004,2003,2001,2000,1992,1991,1989,1988,1987,1986,1985,1984,1983,1982,1981,1980,1979,1978,1977,1976,1975,1974
This statistics in other country:
AfghanistanAlbaniaAlgeriaAndorraAngolaAntigua and BarbudaArab WorldArgentinaArmeniaArubaAustriaAzerbaijanBahamas, TheBahrainBangladeshBelarusBelgiumBelizeBeninBermudaBhutanBoliviaBosnia and HerzegovinaBotswanaBrazilBritish Virgin IslandsBrunei DarussalamBulgariaBurkina FasoBurundiCabo VerdeCambodiaCameroonCanadaCaribbean small statesCayman IslandsCentral African RepublicCentral Europe and the BalticsChadChileChinaColombiaComorosCongo, Dem. Rep.Congo, Rep.Costa RicaCote d'IvoireCroatiaCubaCyprusCzech RepublicDenmarkDjiboutiDominicaDominican RepublicEarly-demographic dividendEast Asia & PacificEast Asia & Pacific (excluding high income)East Asia & Pacific (IDA & IBRD countries)EcuadorEgypt, Arab Rep.El SalvadorEquatorial GuineaEritreaEstoniaEthiopiaEuro areaEurope & Central AsiaEurope & Central Asia (excluding high income)Europe & Central Asia (IDA & IBRD countries)European UnionFijiFinlandFragile and conflict affected situationsFranceGabonGambia, TheGeorgiaGermanyGhanaGreeceGrenadaGuatemalaGuineaGuinea-BissauGuyanaHaitiHeavily indebted poor countries (HIPC)High incomeHondurasHong Kong SAR, ChinaHungaryIBRD onlyIcelandIDA & IBRD totalIDA blendIDA onlyIDA totalIndiaIndonesiaIran, Islamic Rep.IraqIrelandIsraelItalyJamaicaJapanJordanKazakhstanKenyaKiribatiKorea, Rep.KuwaitKyrgyz RepublicLao PDRLate-demographic dividendLatin America & Caribbean Latin America & Caribbean (excluding high income)Latin America & the Caribbean (IDA & IBRD countries)LatviaLeast developed countries: UN classificationLebanonLesothoLiberiaLibyaLiechtensteinLithuaniaLow & middle incomeLow incomeLower middle incomeLuxembourgMacao SAR, ChinaMacedonia, FYRMadagascarMalawiMalaysiaMaldivesMaliMaltaMauritaniaMauritiusMexicoMiddle East & North AfricaMiddle East & North Africa (excluding high income)Middle East & North Africa (IDA & IBRD countries)Middle incomeMoldovaMonacoMongoliaMontenegroMoroccoMozambiqueMyanmarNamibiaNauruNepalNetherlandsNew ZealandNicaraguaNigerNorwayOECD membersOmanOther small statesPacific island small statesPakistanPalauPanamaPapua New GuineaParaguayPeruPhilippinesPolandPortugalPost-demographic dividendPre-demographic dividendQatarRomaniaRussian FederationRwandaSamoaSan MarinoSao Tome and PrincipeSaudi ArabiaSenegalSerbiaSeychellesSierra LeoneSingaporeSint Maarten (Dutch part)Slovak RepublicSloveniaSmall statesSolomon IslandsSomaliaSouth AfricaSouth AsiaSouth Asia (IDA & IBRD)South SudanSpainSri LankaSt. Kitts and NevisSt. LuciaSt. Vincent and the GrenadinesSub-Saharan Africa Sub-Saharan Africa (excluding high income)Sub-Saharan Africa (IDA & IBRD countries)SudanSurinameSwazilandSwedenSwitzerlandSyrian Arab RepublicTajikistanTanzaniaThailandTimor-LesteTogoTongaTrinidad and TobagoTunisiaTurkeyTurks and Caicos IslandsTuvaluUgandaUkraineUnited Arab EmiratesUnited KingdomUpper middle incomeUruguayUzbekistanVanuatuVenezuela, RBVietnamWest Bank and GazaWorldYemen, Rep.ZambiaZimbabwe Timeline:
This timeline shows a graph from 1974 to 2015 of Cameroon. No data until 1973. Number of actual observations by date: 32.
Source name:
World Development Indicators
Source organization:
UNESCO Institute for Statistics
Categories, topics:
Education, Gender
Last updated:
apr 23, 2017
Indicators value changes by year
Minimum:
12.721
jan 1, 2013
Maximum:
30.684
jan 1, 1983
At the date of observation
Value
Absolute change
Change from previous value
jan 1, 1974
26.358
+26.358
0.0%
jan 1, 1975
27.478
+1.12
4.25%
jan 1, 1976
26.834
-0.644
-2.34%
jan 1, 1977
25.539
-1.296
-4.83%
jan 1, 1978
26.44
+0.902
3.53%
jan 1, 1979
18.907
-7.533
-28.49%
jan 1, 1980
27.766
+8.859
46.85%
jan 1, 1981
29.739
+1.973
7.1%
jan 1, 1982
30.387
+0.648
2.18%
jan 1, 1983
30.684
+0.297
0.98%
jan 1, 1984
30.326
-0.358
-1.17%
jan 1, 1985
30.026
-0.3
-0.99%
jan 1, 1986
29.524
-0.503
-1.67%
jan 1, 1987
29.969
+0.445
1.51%
jan 1, 1988
30.096
+0.127
0.42%
jan 1, 1989
29.751
-0.344
-1.14%
jan 1, 1991
29.705
-0.047
-0.16%
jan 1, 1992
30.246
+0.542
1.82%
jan 1, 2000
26.796
-3.45
-11.41%
jan 1, 2001
26.801
+0.005
0.02%
jan 1, 2003
25.853
-0.949
-3.54%
jan 1, 2004
26.401
+0.548
2.12%
jan 1, 2005
25.6
-0.801
-3.03%
jan 1, 2006
26.127
+0.528
2.06%
jan 1, 2007
26.757
+0.629
2.41%
jan 1, 2008
20.768
-5.989
-22.38%
jan 1, 2009
17.45
-3.318
-15.98%
jan 1, 2010
15.163
-2.287
-13.11%
jan 1, 2011
13.536
-1.627
-10.73%
jan 1, 2012
12.891
-0.644
-4.76%
jan 1, 2013
12.721
-0.171
-1.32%
jan 1, 2015
13.198
+0.477
3.75%
Ranking of countries by current statistics by years


Comments: